

XRP/USD Price Fluctuates in Ranges

XRP/USD Price Fluctuates in Ranges – March 21
It has been that the Ripple XRP/USD price fluctuates in ranges between $0.90 and $0.60 lines. The crypto economy has experienced a high of $0.82 and a low of $0.78 at an average percentage of 1.10 positives.
XRP/USD Price Fluctuates in Ranges: XRP Market
Key Levels:
Resistance levels: $0.90, $0.95, $1.00
Support levels: $0.60, $0.55, $0.50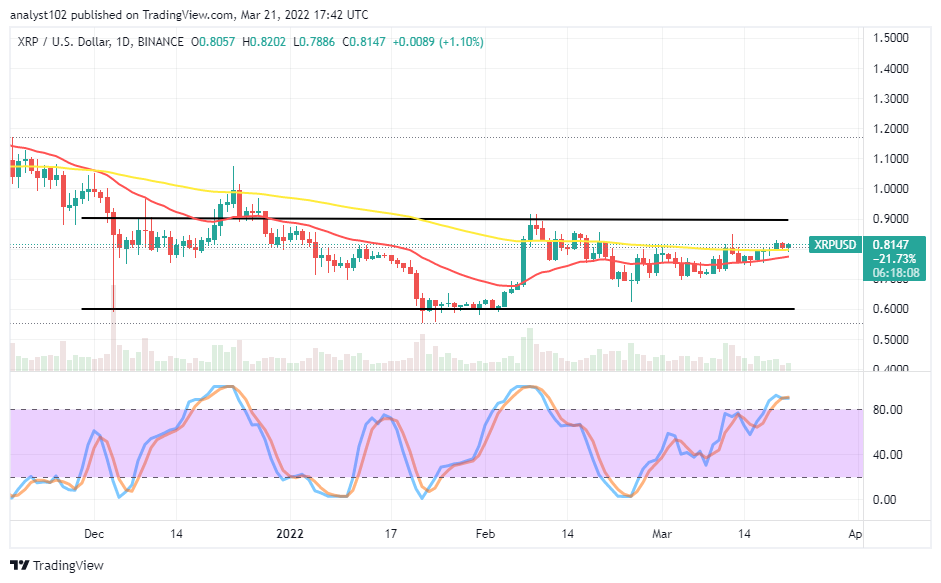 XRP/USD – Daily Chart
The Ripple XRP/USD daily chart shows the crypto-economic price fluctuates in ranges of $0.90 as the upper value-line and $0.60 as the lower range-line. Several ups and downs have materialized more often than none between the upper range-line and $0.70 on the long-term trading analytics chart. The 50-day SMA indicator is above the 14-day SMA indicator. The Stochastic Oscillators are in the overbought region, waiting to point to a particular direction that price tends to go next.
Which kind of trading approach should traders keep as the Ripple XRP/USD price fluctuates in ranges?
As it established that the Ripple XRP/USD market currently possesses a range-bound trading outlook, traders may have to be on the lookout for the exhaustion of price action at each of the upper and lower range lines to exert an order. In other words, long-position placers would have to take a launch of their positions when the market moves downward around to the lower range-line at $0.60.
On the downside of the technical analysis, the Ripple XRP/USD market short-position placers may have to watch out for active reversal of price movements intended toward the $0.90 upper range-line before going for shorting orders. As of writing, traders would have to exercise patience for a while. The reason is that the market is relatively undergoing a less-active moving mode at its current trading capacity spot.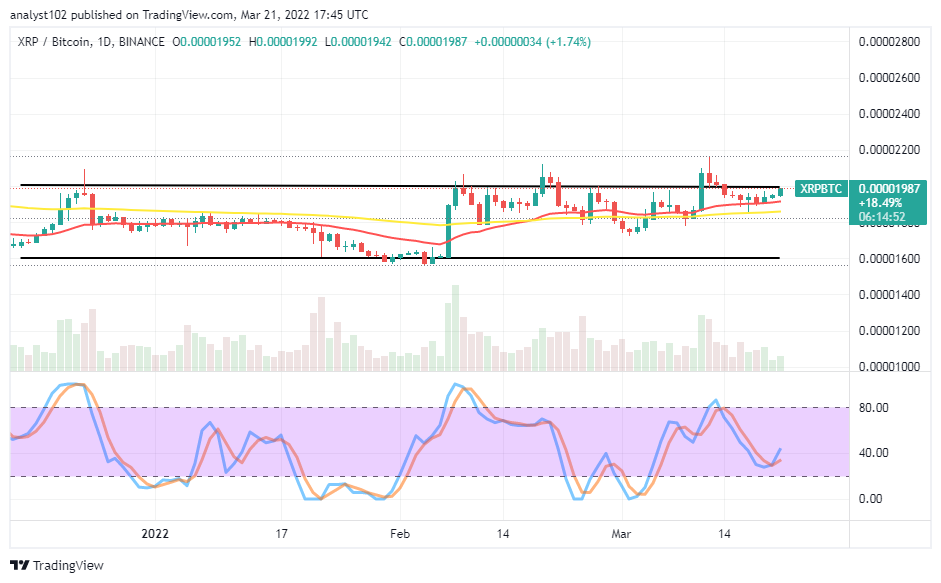
XRP/BTC Price Analysis
In comparison, the Ripple XRP market is making a series of efforts to push higher against Bitcoin. The cryptocurrency pair price fluctuates in ranges. But, so many trading activities have been featuring closely beneath the upper range-line of the market. The 14-day SMA indicator is closely above the 50-day SMA indicator. The Stochastic oscillators are into the ranges of 40 and 20, trying to cross their lines northbound against the higher range value. That indicates the base crypto may push firmly against the flagship counter crypto.
Looking to buy or trade Bitcoin (BTC) now? Invest at eToro!

68% of retail investor accounts lose money when trading CFDs with this provider.
Read more:
