

XRP/USD May have Started a Downtrend

Join Our Telegram channel to stay up to date on breaking news coverage
Recently the XRP/USD price action attempted to break a resistance that aligns with a notable Fib level of 61.80. Subsequently, it appears as if this attempt triggered a significant amount of selling orders. Consequently, this brought about the failure of price breaking this resistance.
Ripple Analysis Statistics Data:
XRP value now: $0.4676
Ripple market cap: $23.43 billion
XRP moving supply: 48.89 billion
The Total supply of Ripple: 99.99 billion
XRP’s Coinmarketcap ranking: #6
In this analysis, we will conduct further studies on the XRP/USD and XRP/BTC markets. This will assist us to know what we can expect from this Market and how to prepare for happenings in this market.
Important Price Levels:
Resistance: $0.4700, $0.4730, $0.4760
Support: $0.4676, $0.4640, $0.4600
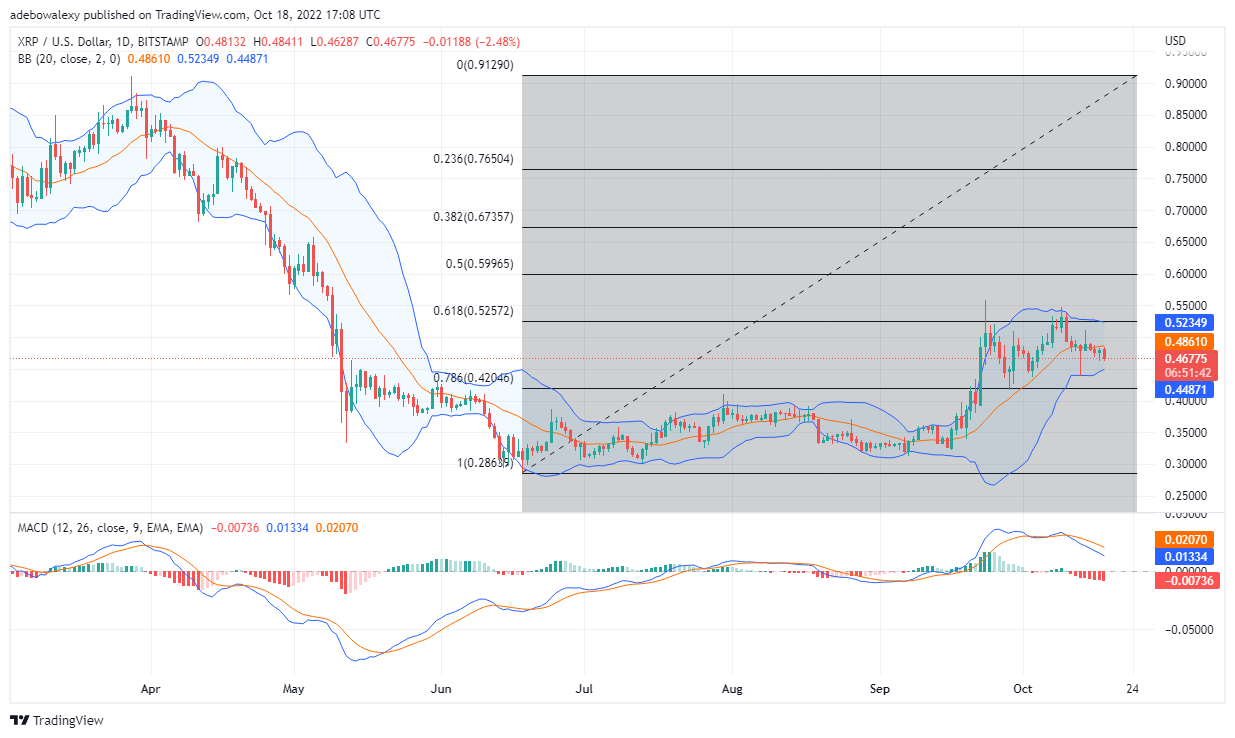
Ripple Price Prediction Today, October 19, 2022: XRP/USD Set To test Lower Support
The last candle on the XRP/USD daily market chart reveals how strong the bears have grown in this session. Additionally, this has brought price candles under the Moving Average curve. As much as this could be thought of as a minor pullback since the present price level seems higher than previous points of retracement, we need to consider the MACD indicator. On the MACD, the histogram bar is growing very sharply on the negative side, to signify an increase in downside momentum. We can anticipate that the price may fall near $0.4550, or $0.4205 in the worst-case scenario. Traders can use the above-mentioned price levels as an entry point as the price may resume the overall uptrend from there.
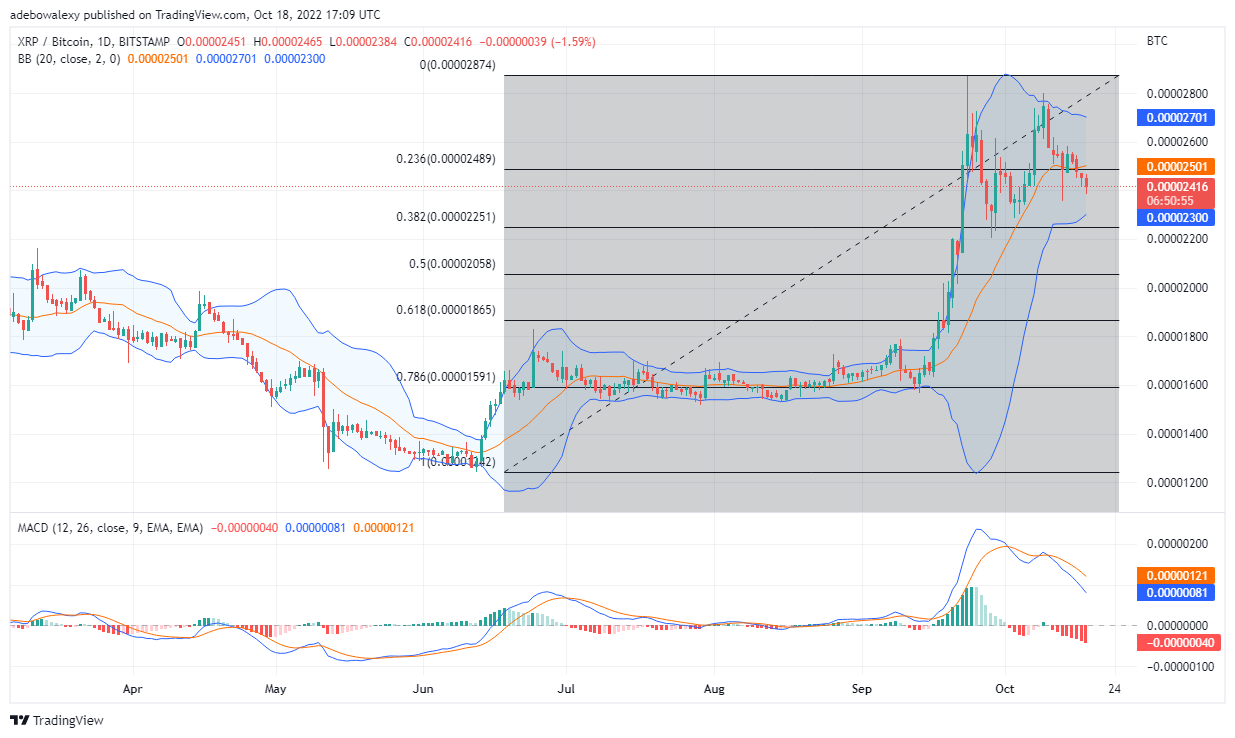
Ripple Price Prediction Today, October 19, 2022: XRP/BTC Eying the Fibonacci Level 38.20
On the XRP/BTC market, it appears as if the recent strength that has returned to the Bitcoin market is causing serious set back in this market. Price movement failed to find support at the 23.60 fib level, subsequently, this resulted in its falling to 0.00002416. Also, we can assume that price action has started a decisive downtrend as ripple versus bitcoin value has fallen significantly below the Moving Average curve.
Furthermore, the MACD has now performed a bearish crossover above 0.00 and is now moving downwards. The display on the indicator portrays that a downtrend has started, and that price in this market will fall lower. If downward forces continue to increase in momentum without resistance price may fall to 0.00002251 soon.
- Early Stage Presale Live Now
- Doxxed Professional Team
- Use Cases in Industry – Offset Carbon Footprint
Join Our Telegram channel to stay up to date on breaking news coverage
