

XRP Trading Close To $0.30, How Long Will The Support Hold?

XRP has retraced on its chart over the last few days although the coin had attempted to head upwards, the bulls tired out.
XRP at the moment has secured $0.30 as a strong support level. Price of the asset has to rise above its immediate resistance over the upcoming trading sessions in order for the bulls to take charge.
If the coin fails to sustain the current price level, a fall beneath $0.30 is just a matter of time. Technical outlook for the coin painted mixed signals on the chart.
Some of the indicators hinted towards a rise in bullish price action.
Over the last 24 hours the coin depreciated by 4.4%, invalidating most gains XRP logged in the past week. Sellers continue to dominate the market however, buyers were also trying to re-enter as the current price has created a demand zone for the asset.
For XRP to negate its bearish thesis, strength from the broader market will be required. The global cryptocurrency market cap today is $955 Billion with a 3.1% negative change in the last 24 hours.
XRP Price Analysis: Four Hour Chart
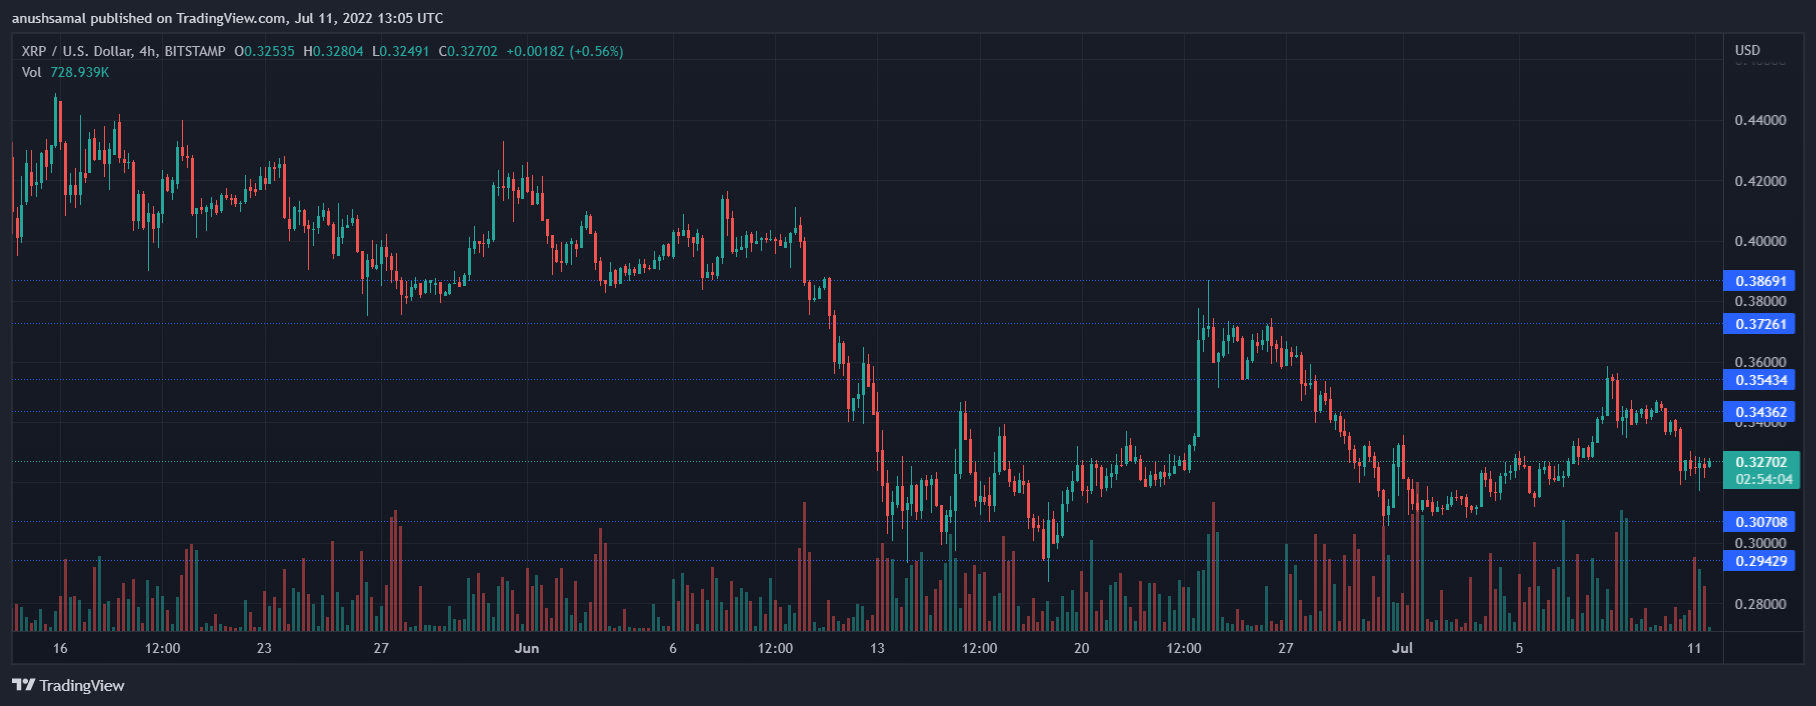
The asset was trading at $0.33 at press time. It was trading very close to the $0.30 support line. Invalidating the same will push price of XRP to $0.28. If XRP trades for a considerable time over the $0.33 price level, the XRP might attempt to trade near $0.34 and then at $0.37.
If XRP manages to topple over the $0.37 price mark then it might be able to retest $0.43. Volume of XRP traded fell in the previous trading session indicating that buying pressure has fallen on the chart. This marked bearish pressure on XRP’s chart.
Technical Analysis
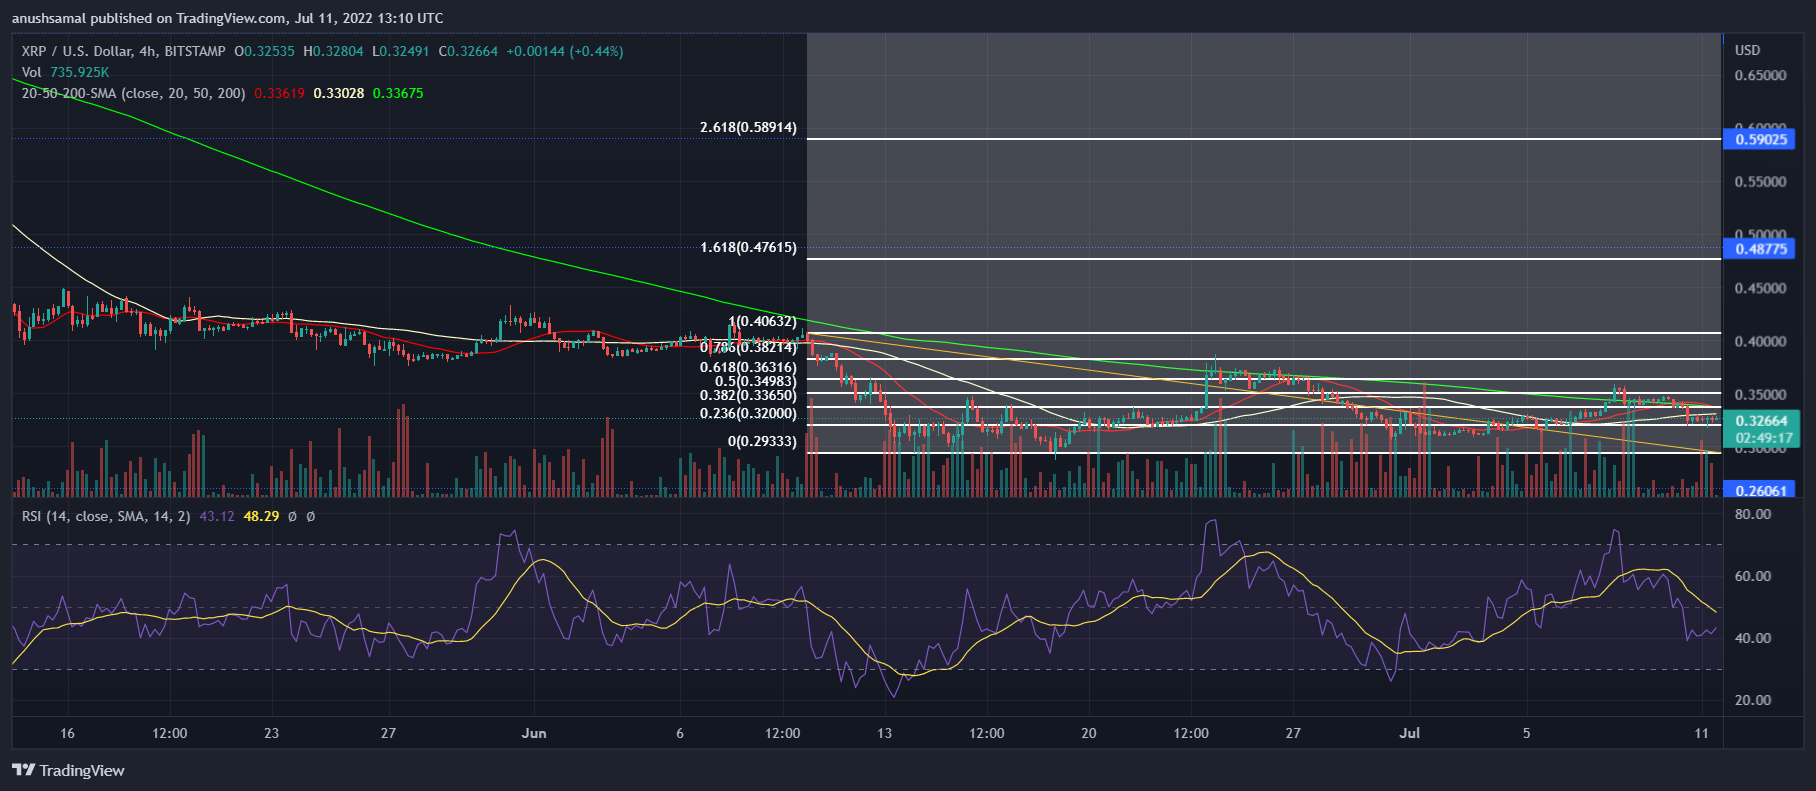
XRP’s buying strength remained low, the same was reflected on the Relative Strength Index. RSI was parked below the half-line and it meant that selling pressure was more than buying pressure.
In accordance with the same, the price of XRP was below the 20-SMA line signifying that sellers were driving the price momentum in the market.
Going by the Fibonacci retracement levels, there is rigid resistance between the 38.2% and 23.6% levels respectively. Support level for the coin was at the $23.6% line for the digital asset.
Related Reading | Why Peter Brandt Thinks Cardanos Price Is The Definition Of Ugly
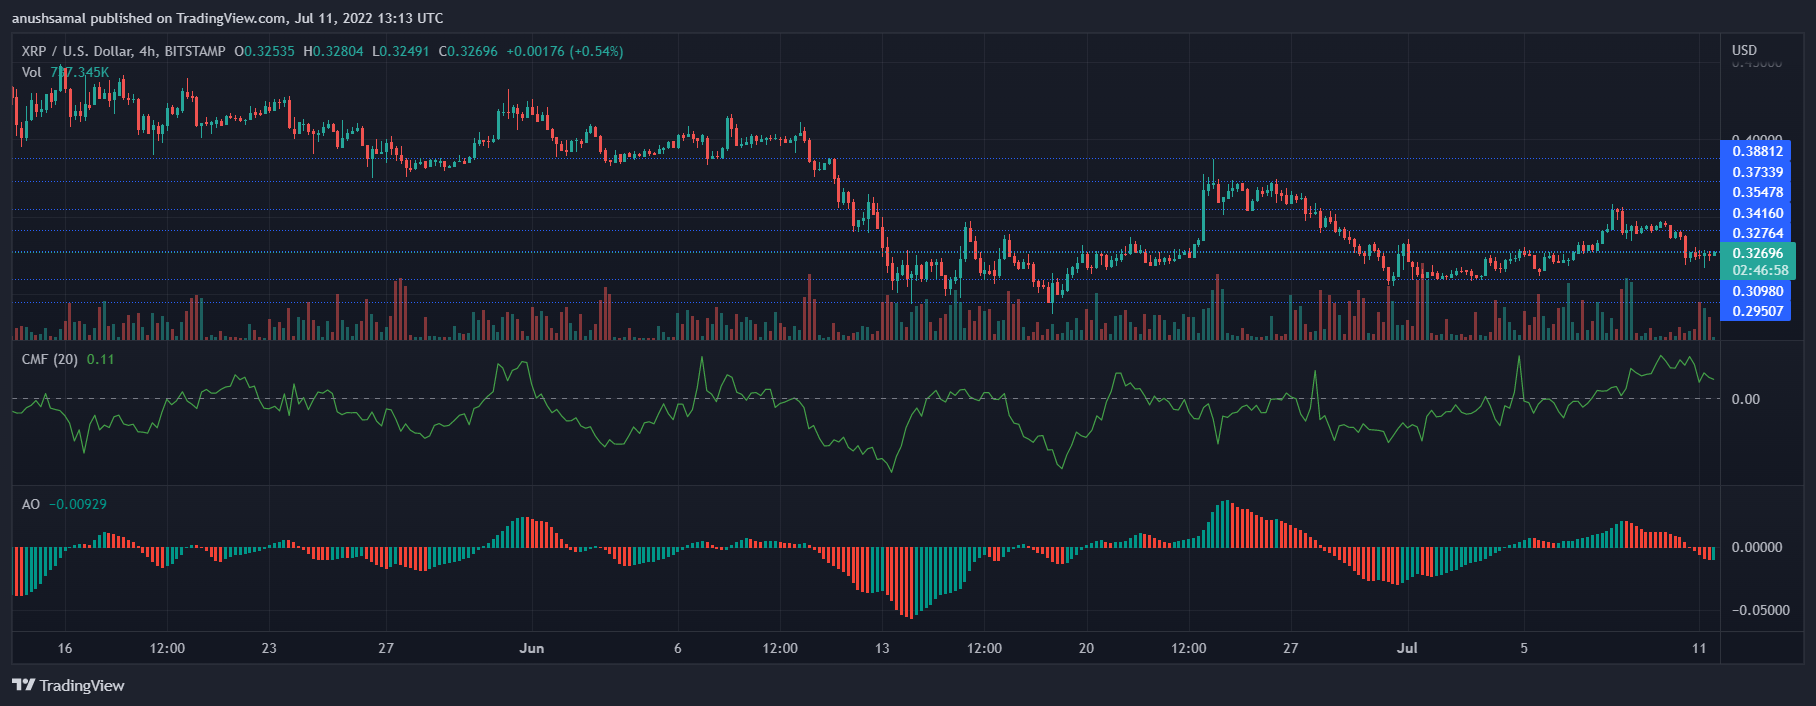
The technical outlook painted a mixed signal. Chaikin Money Flow which depicts the capital inflows and outflows was positive. The positive CMF is a sign of increase in buying strength. The small uptick on the RSI corresponds to increased capital inflows.
Awesome Oscillator indicated price momentum and reversal in the price trend. AO flashed red histograms which was indicative of a sell signal. At press time however, AO displayed a single green bar but it was too early to say if XRP will be bullish over the immediate trading sessions.
Related Reading | Ethereum Liquidations Ramp Up As Price Struggles To Hold $1,100
Featured image from InvestorPlace, chart from Tradingview.com
