

Universal Market Price Prediction: UMA Makes a Spike

Join Our Telegram channel to stay up to date on breaking news coverage
Universal Market Price Prediction – October 13
The declining force has featured in a manner producing smaller-lower lows that have reached a point of exhaustion in the UMA/USD market operation as the crypto-trade makes a spike closely over the $2 trading line. The all-time low and high-value points are $1.16 and $43.37 since about two years of operations.
UMA Price Statistics:
UMA price now – $2.24
UMA market cap – $152.2
UMA circulating supply – 68.95 million
UMA total supply – 108.9 million
Coinmarketcap ranking – #148
UMA/USD Market
Key Levels:
Resistance levels: $3, $3.50, 44
Support levels: $2, $1.50, $1
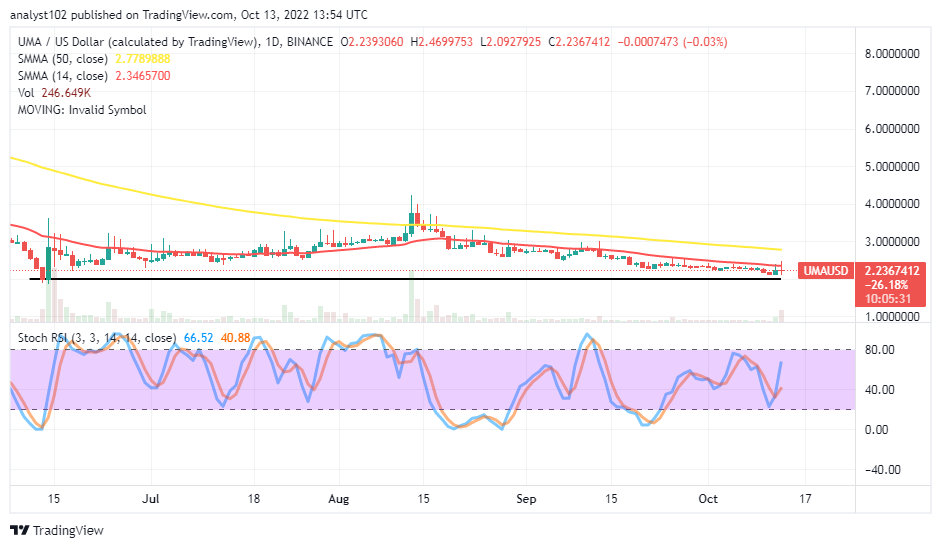 UMA/USD Daily Chart
The UMA/USD daily chart reveals the market makes a spike from a near zone above the horizontal line drawn at the $2 support level. The 14-day SMA indicator is at $2.35 point, underneath the $2.78 value line of the 50-day SMA indicator. A candlestick has formed to signify an indecision trading outlook around the trend line of the smaller SMA. The Stochastic Oscillators have swerved northbound from the range of 40 to 40.88 and 66.52 range values.
Buy Universal Market Now
Your capital is at risk
Is it a good time to invest in the UMA/USD market, or is it only for the trading psyche?
As the Universal Market makes a spike against the US currency, it would be a technical concept for investors to increase the size of their portfolios in the crypto trade operations. It is a sign that the price may recoup some of the lost value to the US economy. Over a couple of sessions, the market valuation has continued to hold the operations closely beneath the trend line of the 14-day SMA near the $2 support level. Buyers may have to go to the point of using a 1-hour chart to determine an early ideal time to observe a buying order at a lower-trading spot.
On the downside of the technical analysis, the UMA/USD trade bears may have to look for a loophole suggesting the possibility of the market losing the energy to surge high sustainably over the 14-day SMA trend line, especially on its buying signal point before exerting a sell order. At this point, short-position placers need to be wary of breaking out of the market around the $3 resistance level.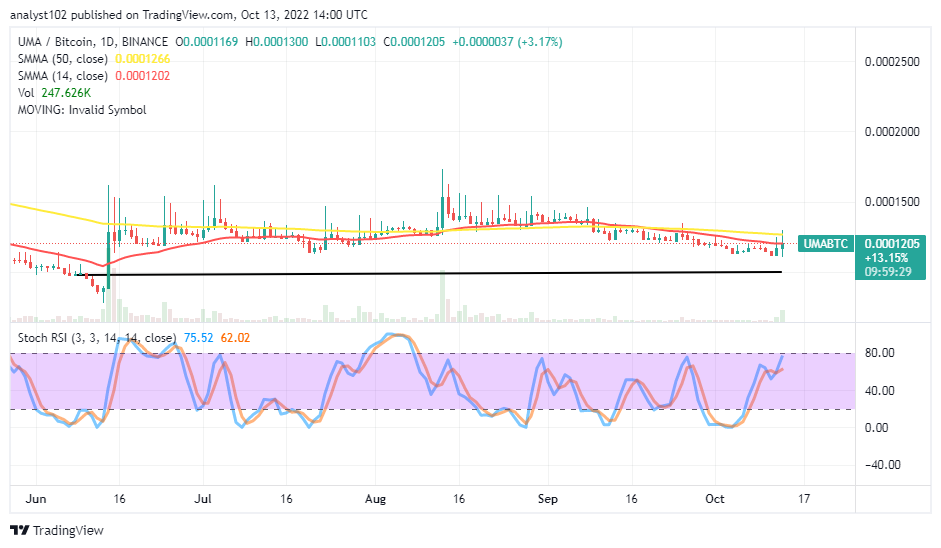
UMA/BTC Price Analysis
To break through the SMAs’ trend lines and move toward the moon, Universal Market makes a spike against Bitcoin. The pairing cryptocurrency price has been trying not to draw down beyond the horizontal line drawn underneath the SMA trend lines over time. The 14-day SMA indicator is below the 50-day SMA indicator. The Stochastic Oscillators are to swerve northbound further at 62.02 and 75.52 range values. That signifies the base crypto risks the potentiality of exhausting its strength in no time while even being bullish, pushing northward against the flagship trading crypto.
Tamadoge – Play to Earn Meme Coin

- Earn TAMA in Battles With Doge Pets
- Maximum Supply of 2 Bn, Token Burn
- Now Listed on OKX, Bitmart, LBank, MEXC, Uniswap
- Ultra Rare NFTs on OpenSea
Read more:
Join Our Telegram channel to stay up to date on breaking news coverage
