

SRM/USD Prepares for a Breakout

Join Our Telegram channel to stay up to date on breaking news coverage
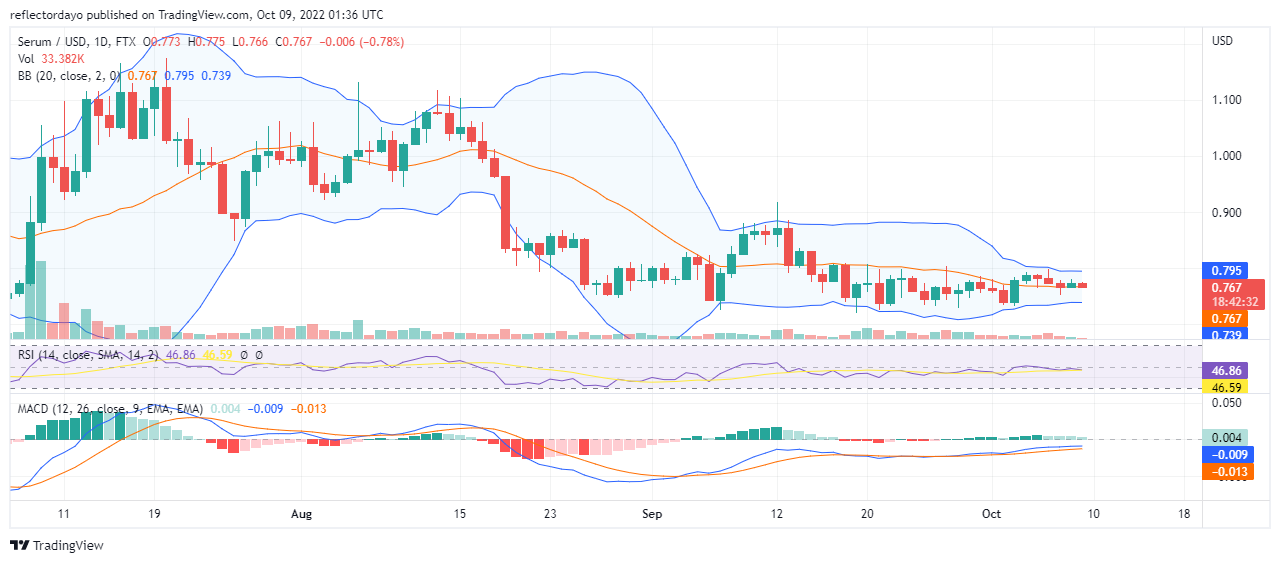
On the 7th of September, the Serum market broke out to the upside; aiming to reach a higher price. From the 7th to the 10th of September, three significant candles appeared on the chart to give us the impression that the market is trending up. But, at the height of $0.875, the price of the bullish advancement was held up as bearish activities increased. Eventually, the bears won and took the market on the 14th of September.
SRM Market Price Statistic:
- SRM/USD price now: $0767
- SRM/USD market cap: $202,262,615
- SRM/USD circulating supply:263,244,669
- SRM/USD total supply: 1,092,844,982
- SRM/USD coin market ranking: #132
Key Levels
- Resistance: $ 0.777, $0.800, $0.820
- Support: $0.760, $0.740, $0.720
Buy Serum Now

Your capital is at risk
Serum Market Price Analysis: The Indicators’ Point of View
Bullish activities begin to increase from the 17th of September and this made the price actions of the market move in a very rapid and irregular pattern because both the bulls and bears were very active in the market. But from the 4th of October till date, both the selling pressure and the buying pressure reduced as the volume of the market traded also reduces. This is evident as the upper and lower band of the Bollinger indicator compresses. As the upper and lower band compresses, we should expect an imminent price breakout. The consolidation in the market is getting stronger as the support and resistance of the market are increasing in proximity. That is why the RSI Indicator measures at the midrange. The MACD also supports this as it seems like the faded green histograms and the MACD lines also are becoming converged at the midrange (that is zero point) of the indicator (the point of equilibrium).
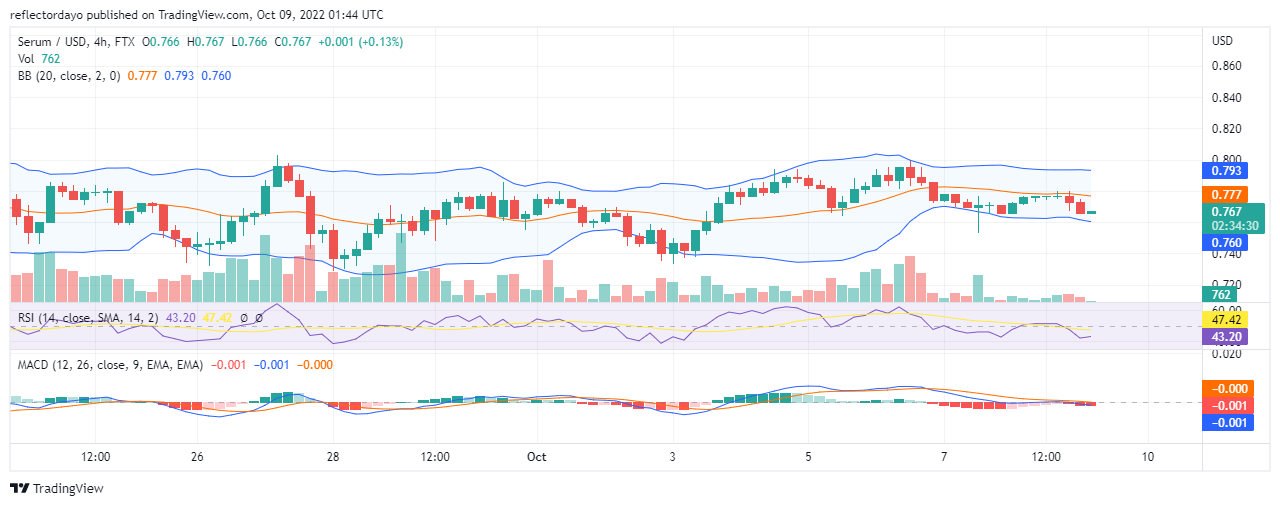
SRM/USD 4-Hour Chart Outlook
When we look at this timeframe it looks like the market is breaking out to the downside. However, we can’t say this is a breakout because the momentum is not strong enough to move the market farther from the current price level. Also, bullish activities are resisting the bearish advances. It will take a stronger price pull or push to determine the market’s new direction.
Tamadoge – Play to Earn Meme Coin

- Earn TAMA in Battles With Doge Pets
- Maximum Supply of 2 Bn, Token Burn
- Now Listed on OKX, Bitmart, Uniswap
- Upcoming Listings on LBank, MEXC
Join Our Telegram channel to stay up to date on breaking news coverage
