

NEAR Protocol bulls try to overrun a region of resistance will they succeed?

Disclaimer: The information presented does not constitute financial, investment, trading, or other types of advice and is solely the writers opinion
- The market structure on higher timeframe remained bearish
- A breakout past the bearish order block would flip the bias in favor of the buyers
Bitcoin [BTC] hasn’t managed to show a notable trend on the charts over the past ten days, not even on the lower timeframes. There were liquidity grabs and quick price movements that shook out over-leveraged traders.
Are your NEAR holdings flashing green? Check the Profit Calculator
Over the past two days, some of the altcoins have begun to come to life. NEAR was not among them, as it has mostly followed Bitcoin’s price movement. However, the bulls have pushed the prices higher by 6.7% in the past five days.
The H4 bearish order block was retested, but will it give way?
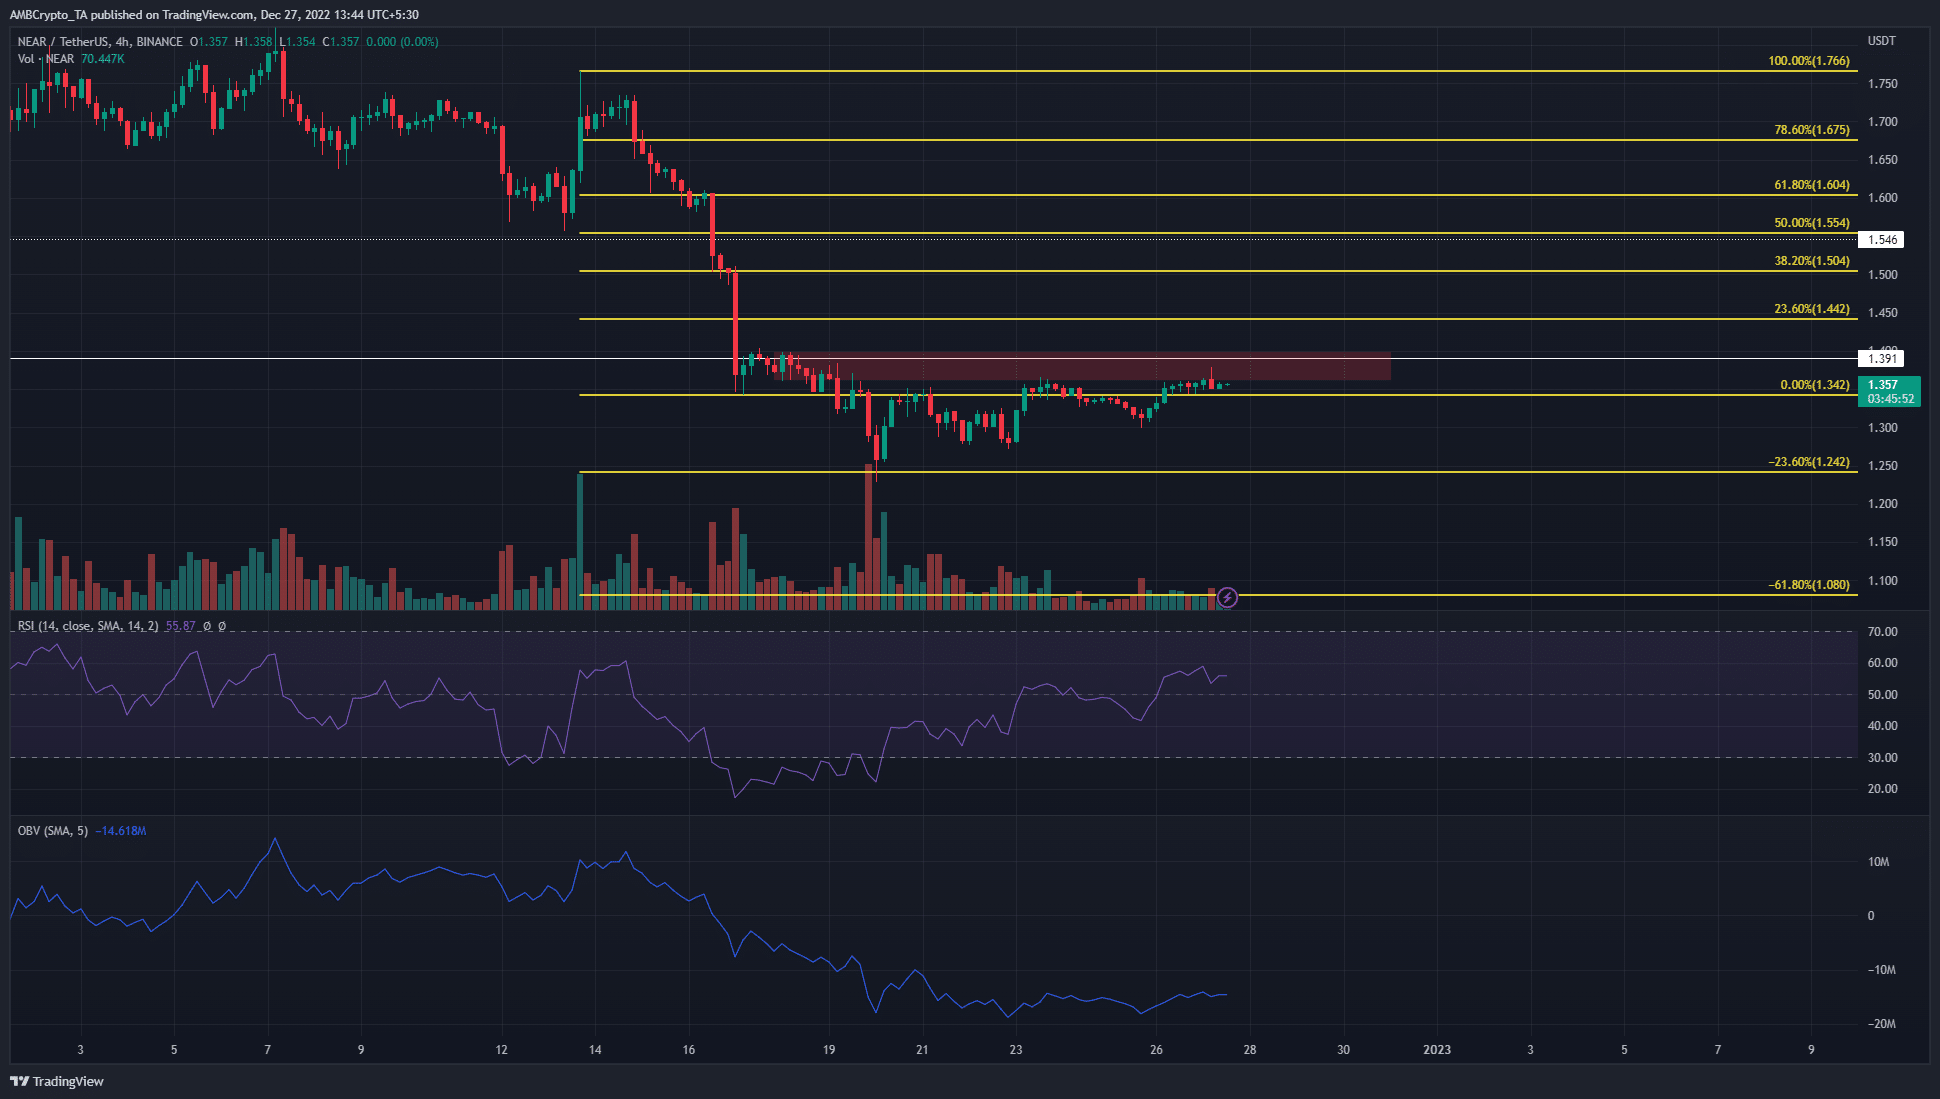
Source: NEAR/USDT on TradingView
Based on NEAR’s drop from $1.76 to $1.34 in mid-December, a set of Fibonacci retracement levels (yellow) was plotted. The 23.6% extension level at $1.24 has been tested as support, and the price saw a decent reaction upward off that level.
At the same time, the Relative Strength Index (RSI) also recovered. At press time, the indicator had pushed past the neutral 50 mark to show bullish intent, although it was somewhat weak. Yet, the On-Balance Volume (OBV) showed no signs of recovery.
On the higher timeframes, the market structure was bearish. A move past the horizontal level at $1.39 and a subsequent retest could offer a lower timeframe buying opportunity. However, unless the OBV can begin to climb back higher, buyers would need to be cautious.
How many NEARs can you get for $1?
Further north, the $1.45-$1.5 area is also likely to pose resistance. Therefore, more risk averse buyers can wait for this level to be flipped to support. On the other hand, a rejection at $1.39 can see NEAR drop back to the 23.6% extension level at $1.24.
OI picks up over the past week as the bulls attempt to break $1.35
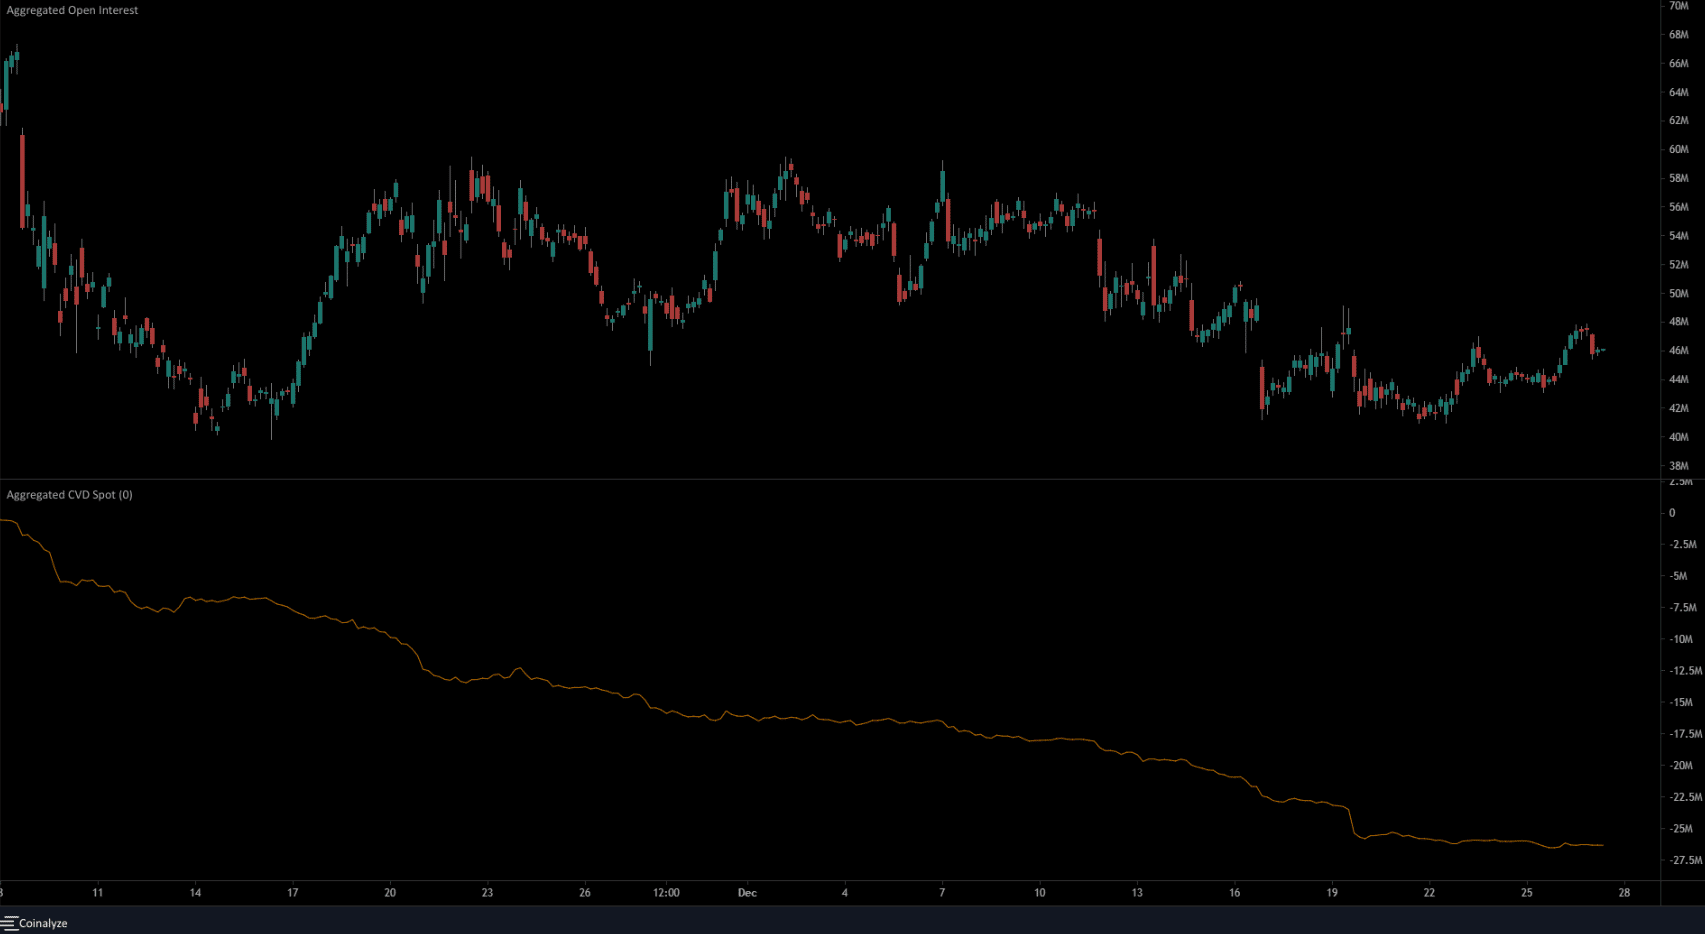
Source: Coinalyze
The spot CVD has been in decline over the past month. This showed consistent seller dominance. In early December the Open Interest was somewhat flat, when NEAR prices bounced between $1.66 and $1.78. After 11 December, the OI began to decline.
The price of NEAR also began to decrease on 14 December, when a bearish market structure break was witnessed. Therefore, the OI signaled discouraged long positions and outlined bearish sentiment behind the asset.
