

MKR/USD Breaks Out of the Downtrend


Join Our Telegram channel to stay up to date on breaking news coverage
In a broader view, the Maker (MKR/USD) market had been in a downtrend as it keep making lower lows along the line. The outlook of the candles that represent each daily trading session is suggesting a high struggle or faceoff between bulls and bears. The struggles have continued to result in slight wins for either of the two market players. However, as the market progresses in September, bulls made an intermittent strong bullish market push that made the market move in an almost horizontal line. This means the bullish strength was increasing as the month goes. Towards the end of the month into October, they became stronger than the bears. And they are now making progressive bullish price advancements.
Maker Market Price Statistic:
- MKR/USD price now: $829.70
- MKR/USD market cap: $810,499687
- MKR/USD circulating supply: 977,631
- MKR/USD total supply: 977631
- MKR/USD coin market ranking: #55
Key Levels
Resistance: $919.47, $1000, $1050
Support: $684.23, $535.32, $500.00

Buy Maker Now
Your capital is at risk
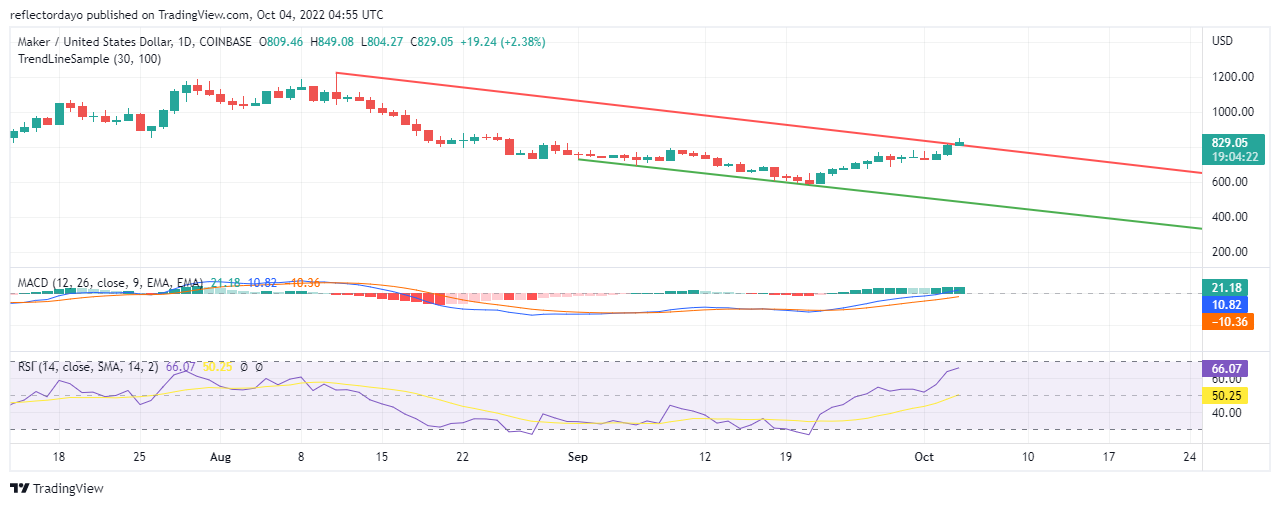
Maker Market Price Analysis: The Indicators’ Point of View
A very significant candlestick pattern that announced the approaching uptrend formed on the 21st and 22nd of September. It was after the bullish engulfing pattern formed that the market began to trend upward. Bulls had gained an amount of strength that is slightly more than that of the bears and they are making progress with it. The MACD had been moving on the positive side since the 22nd of September. However, the histograms show that the bullish strength is not as impressive. The tops of the histograms are flat along the line because they are not making much difference in the height as the market progresses. Although the bullish histograms show not much strength in the momentum, the RSI line is about to cross out of the below-zero level.
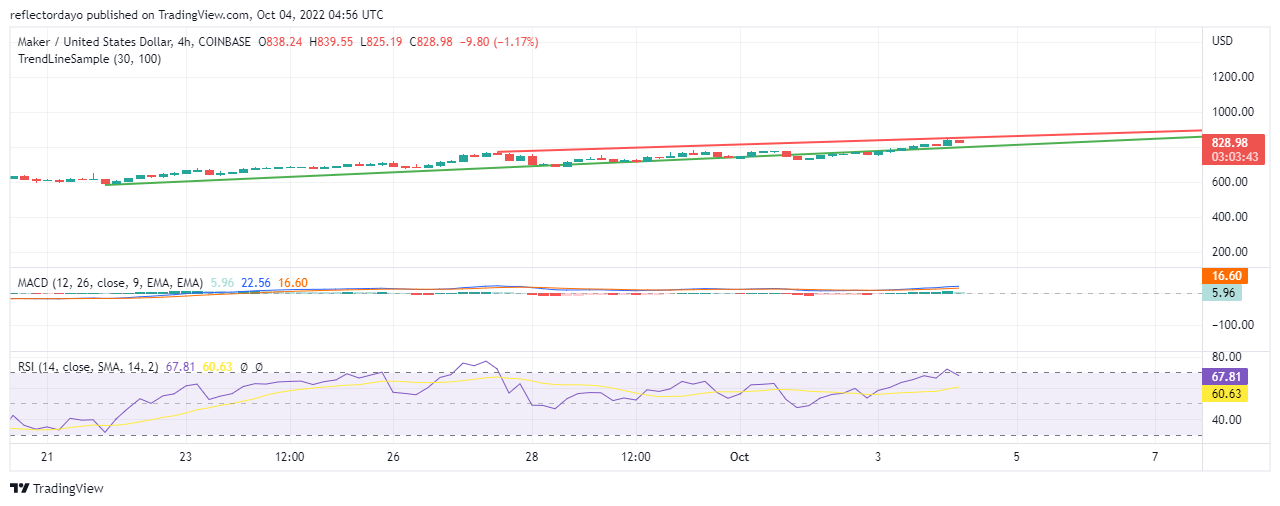
MKR/USD 4-Hour Chart Outlook
The bears became active again towards the end of the first session because the price entered the overbought region. And as a result, it makes a corrective price retracement from the overbought. This is what resulted in the price pullback that spill over into the second hour as traders continue to sell.
Tamadoge – Play to Earn Meme Coin

- Earn TAMA in Battles With Doge Pets
- Maximum Supply of 2 Bn, Token Burn
- Now Listed on OKX, Bitmart, Uniswap
- Upcoming Listings on LBank, MEXC
Join Our Telegram channel to stay up to date on breaking news coverage
