MATIC Price Shows Bullish Formation

MATIC has experienced a downward trend over the past few months, but there is a possibility of a reversal. In the last 24 hours, the altcoin attempted a slight 0.2% increase, but the weekly chart showed a 13% depreciation, indicating a strong bearish dominance from a technical standpoint.
Both demand and accumulation indicators were negative, despite some buying strength attempting to recover. As Bitcoin surged above the $26,000 mark, many altcoins, including MATIC, are also attempting to move upward on their respective charts.
However, for the altcoin to reverse its price action, it is crucial for Bitcoin to maintain a price above $26,000. Additionally, buying strength needs to enter the market during the immediate trading sessions.
MATIC faces an important overhead resistance level that it must surpass in order to experience a significant rally. The decline in MATIC’s market capitalization indicates a low buying strength on the chart.
MATIC Price Analysis: One-Day Chart
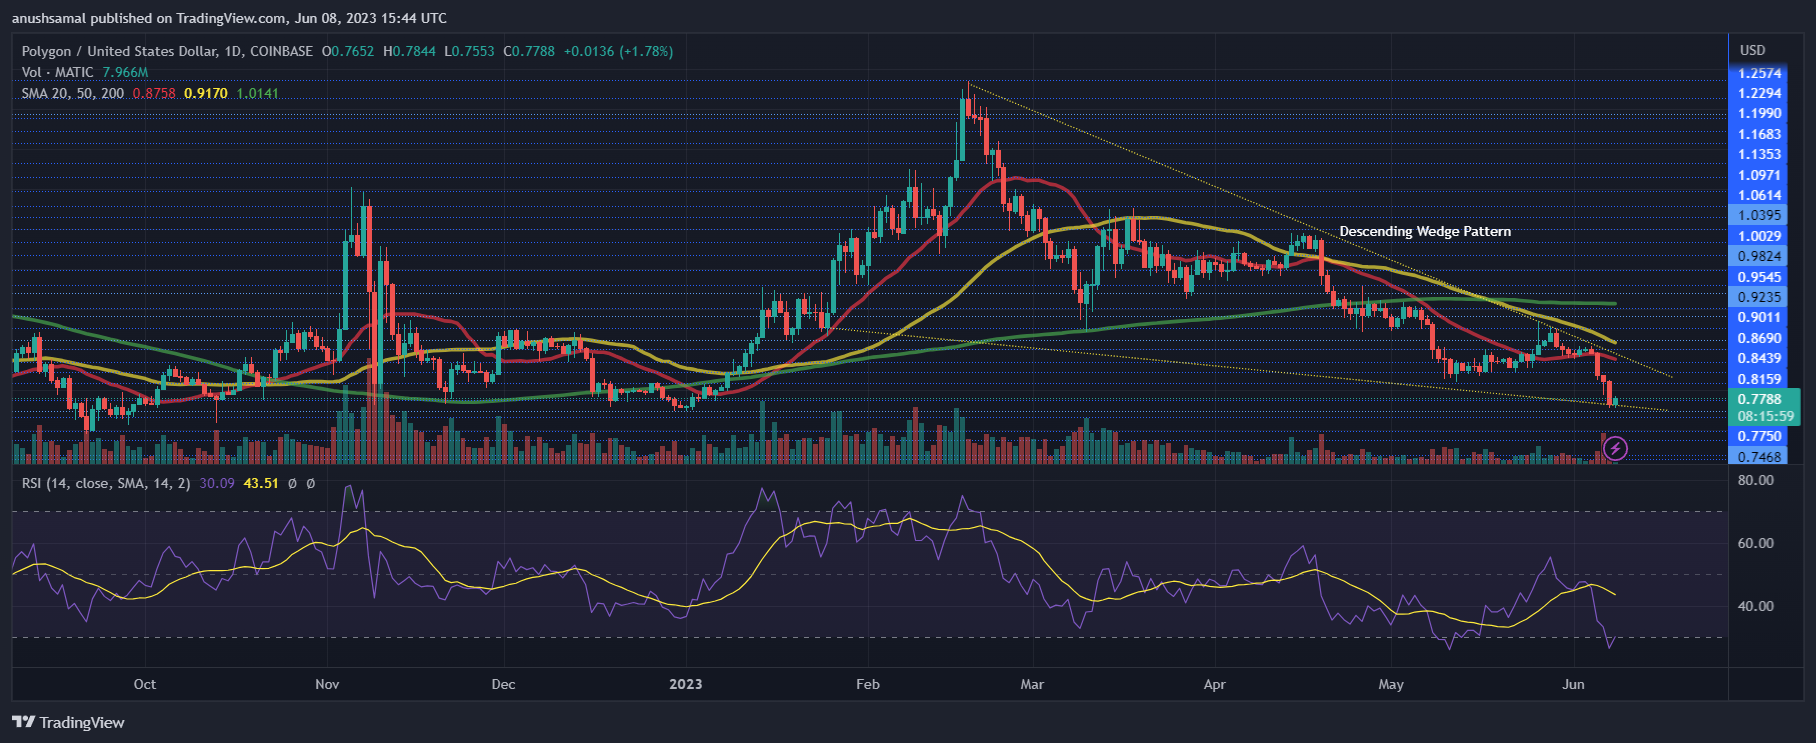
At the time of writing, MATIC was trading at $0.77, which is close to its multi-month low of $0.75, recorded 6 months ago. The coin is facing overhead resistance at $0.80, and if it manages to break past that level, it might attempt to reach $0.93.
Notably, the coin has formed a descending wedge pattern, which is typically associated with a bullish price reversal. In the event of an upside breakout, MATIC could potentially rally as high as $1.50.
However, there is a possibility that the altcoin may find support at the $0.76 level. Failing to remain above this level could result in MATIC trading below the $0.74 price mark. It is worth noting that the amount of MATIC traded in the last session was low, indicating a higher selling strength on the chart.
Technical Analysis

Following the rejection at the $0.84 resistance level, buyers have lost confidence in MATIC. The Relative Strength Index (RSI) currently sits below the half-line and below the 30-mark, indicating that the coin is oversold at the moment.
Additionally, the price of the coin has fallen below the 20-Simple Moving Average line. This suggested low demand and sellers driving the price momentum. However, if MATIC makes an attempt to rise above the $0.84 mark, it could attract renewed demand and bring back the bulls. This would increase the likelihood of a further rally in the price of the asset.

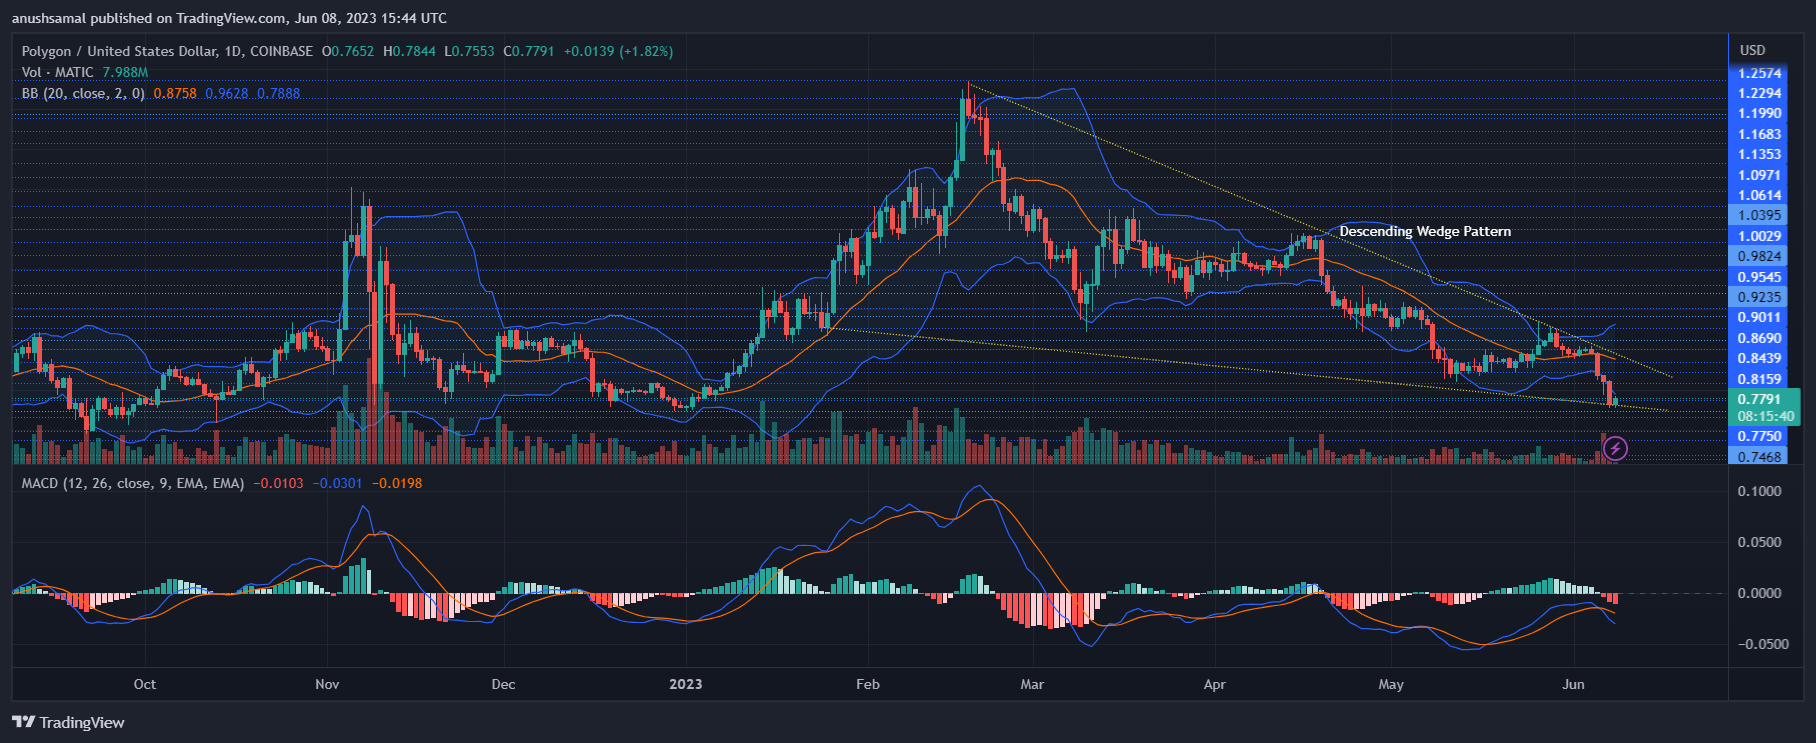
Based on the technical indicators, the coin formed sell signals at the current time. The Moving Average Convergence Divergence (MACD) indicator, which measures price momentum and reversals, displayed red histograms associated with sell signals on the chart. This suggests a potential downward movement in price.
The Bollinger Bands, which assess price volatility and potential fluctuations, have diverged. This indicates that there might be increased volatility in the price of MATIC over the upcoming trading sessions, potentially leading to a price reversal.
Featured Image From UnSplash, Charts From TradingView.com


