

LTC/USD May Cross Above $200
Litecoin Price Prediction – November 1
The Litecoin price prediction could set a bullish run if the market can make an attempt to climb back above the resistance level of $200.
LTC/USD Market
Key Levels:
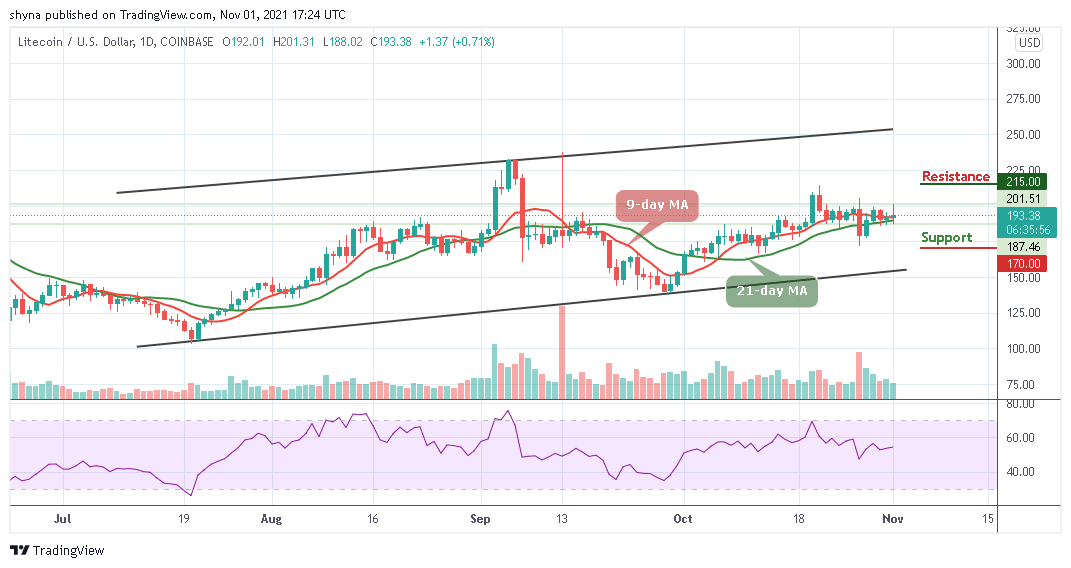
Resistance levels: $215, $225, $235
Support levels: $170, $160, $150
According to the daily chart, LTC/USD is running a little retracement move towards $200 with a price growth of 0.71%. For the fact that the coin is recording some gain, the Litecoin price may continue to maintain a sideways movement within the channel if the coin can stay above the 9-day and 21-day moving averages. Therefore, traders can expect the price to continue to rise as soon as the bulls put more pressure on the market.
Litecoin Price Prediction: Litecoin (LTC) May Demonstrates Bullish Movement
At the time of writing, the Litecoin price is seen hovering above the moving averages at around $193.38. If the Litecoin price crosses below the 9-day and 21-day moving averages, the market price may slide back towards the lower boundary of the channel. But if the price begins to follow the upward movement, traders can then expect a bullish continuation towards the upper boundary of the channel. Meanwhile, as the technical indicator Relative Strength Index (14) is seen moving around 55-level, the possible resistance levels could be found at $215, $225, and $235 in the long term.
However, if the coin keeps the bullish movement for the next couple of days, traders may witness more of it to reach higher levels. Meanwhile, the Litecoin price is currently range-bounding in the short term. Inversely, any bearish movement towards the south could roll the coin back to the long-term support at $170, $160, and $150 levels.

When compares with Bitcoin, Litecoin continues to follow the sideways movement but trading above the 9-day and 21-day moving averages. In case of a trend reversal, there is a need for an increasing volume and resistance to cause an upsurge in the market. At the moment, the Litecoin (LTC) is trading around the 3176 SAT. Therefore, traders can expect close support at the 2900 SAT and below.
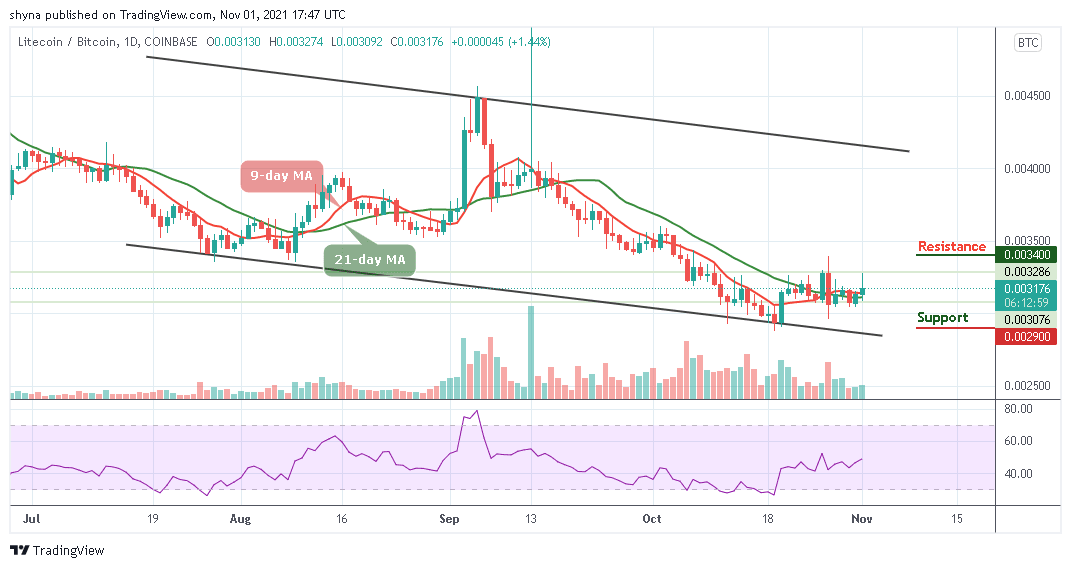
However, if a bullish move continue to push the price above the moving averages to hit the nearest resistance at 3300 SAT; traders can then confirm a bull-run for the coin. Moreover, the closest resistance could be located at 3400 SAT and above as the technical indicator Relative Strength Index (14) moves toward 50-level, suggesting sideways movement.
Looking to buy or trade Litecoin (LTC) now? Invest at eToro!
68% of retail investor accounts lose money when trading CFDs with this provider


 Bitcoin
  Ethereum
  Tether
  BNB
BNB  Solana
  USDC
USDC  XRP
XRP  Dogecoin
  Toncoin