

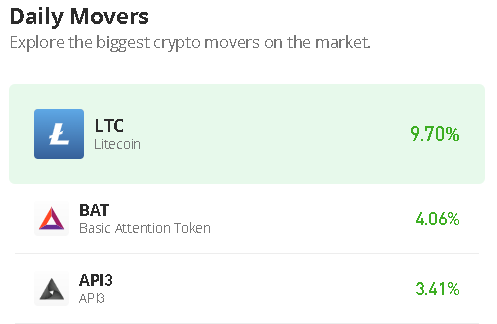
LTC/USD Breaks Above $60 Resistance; Can it Reach $70 Next?
Join Our Telegram channel to stay up to date on breaking news coverage
The Litecoin price prediction escalates, but a break above $70 is expected to push the coin toward the resistance level of $80 in the coming trading sessions.
Litecoin Price Statistics Data:
- Litecoin price now – $60.29
- Litecoin market cap – $4.3 billion
- Litecoin circulating supply – 71.5 million
- Litecoin total supply – 84 million
- Litecoin Coinmarketcap ranking – #19
LTC/USD Market
Key Levels:
Resistance levels: $68, $70, $72
Support levels: $52, $50, $48
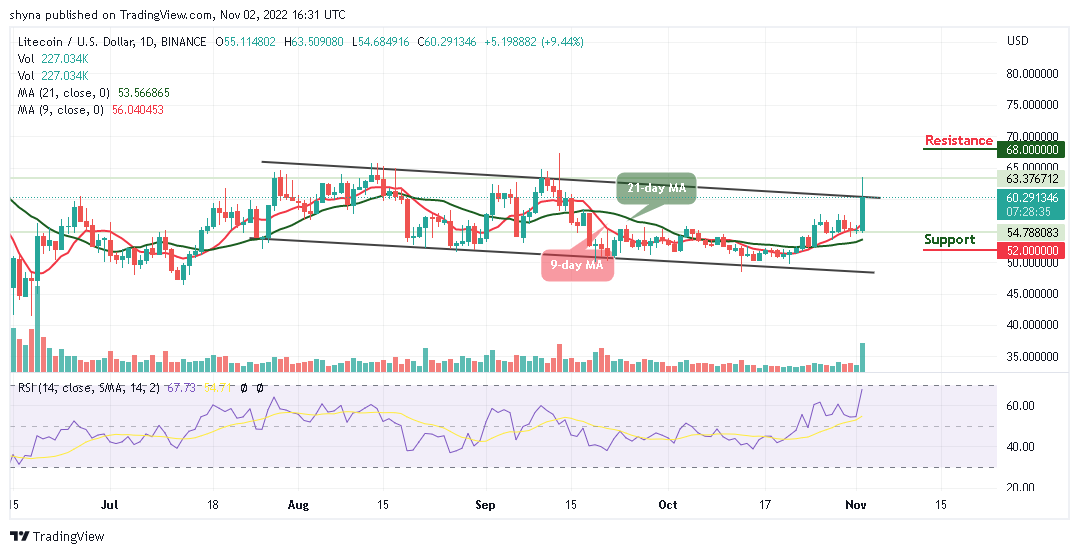
LTC/USD is seen trading around the resistance level of $60.2 after touching the daily high of $63.5 during the European session today. However, touching the daily high at $63.5 is a move that could easily pave the way for gains above $65 and toward $70. Therefore, if the technical indicator Relative Strength Index (14) crosses above the 70-level, the market may show that the bullish grip is getting stronger.
Litecoin Price Prediction: What to Expect from Litecoin (LTC)
The Litecoin price is currently holding the ground above the 9-day and 21-day moving averages after a major recovery from the low of $54.6. This shows that buyers may continue to have the upper hand in the price movement, and they could easily push the coin toward the potential resistance levels of $68, $70, and $72. In other words, if the buying action fails to break above the upper boundary of the channel, the coin could instead settle for consolidation.
However, any breakout above the upper boundary of the channel could have an impact on the price. Furthermore, it is about time that buyers increase their confidence in the recovery because $70 is still achievable. Meanwhile, if the bears bring the coin below the moving averages, the support levels of $52, $50, and $48 may be reached.
Against Bitcoin, the LTC price remains above the 9-day and 21-day moving averages as the 9-day MA is ready to cross below the 21-day MA. Meanwhile, if the market price eventually remains and closes above moving averages, traders might expect a long-term bullish movement.
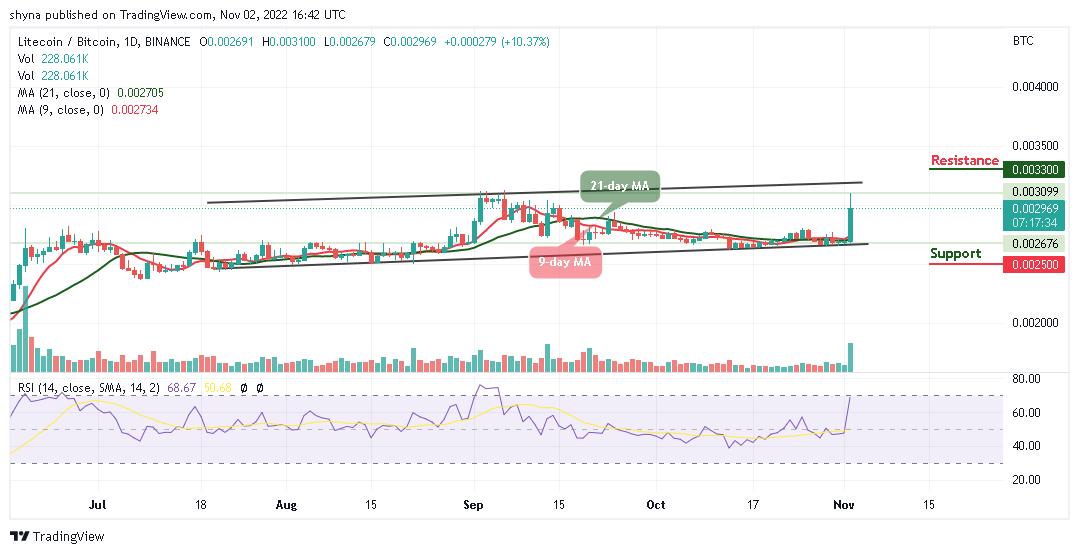
On the other hand, any bearish movement below the lower boundary of the channel may likely meet the major support at 2700 SAT before falling to 2500 SAT and below while the buyers may need to push the market to the potential resistance at 3300 SAT and above as the technical indicator Relative Strength Index (14) moves to cross above the 70-level to give more bullish signals.
IMPT, which is Eco-friendly crypto aims to revolutionize the carbon credit space. Its presale has gone from strength to strength and it has now managed to raise around $12 million. The price increases gradually throughout the presale.
Dash 2 Trade is a new crypto signals platform that has now made around $4 million from its token pre-sale. The project aims to facilitate an improved shopping experience for a community that already has 70,000 people.
Related:
Dash 2 Trade – High Potential Presale
- Active Presale Live Now – dash2trade.com
- Native Token of Crypto Signals Ecosystem
- KYC Verified & Audited
Join Our Telegram channel to stay up to date on breaking news coverage


 Bitcoin
  Ethereum
  Tether
  BNB
BNB  Solana
  USDC
USDC  XRP
XRP  Dogecoin
  Toncoin