

Hope is for the unaware
- Bitcoin price prediction displays a lackluster retaliation after last week’s sudden selloff, though on-chain metrics suggest a bottom may be near.
- Ethereum price and the bullish narrative regarding the upcoming Merge flips as bears threaten to push prices lower.
- XRP price witnesses a turn after a steep decline into the weekly trend. If a rally is to occur, it’s now or never.
As August ends, retail traders have spent the week deciphering the cryptomarkets’ true intentions. Since last week’s sharp decline, the market has been confined within a congestive zone. The mundane price action is likely to resolve in a sharp directional move that many analysts hope will be bullish. Still, an additional decline should not be ruled off the table.
Bitcoin price is close to a bottom
Bitcoin price has traded sideways all week following last Friday’s 16% liquidation. At most, the peer-to-peer digital currency has recovered 3% of the losses accrued. The lack of effort displayed post decline is the first anomaly that merits question in the underlining bullish strength. The VolumeProfile indicator confounds the reasonable doubt as transactions continue to taper.
Still, on-chain analysis tools suggest more optimism is taking place underneath the cryptocurrency hood. Specifically, Santiment’s Daily Active Addresses Indicator shows that large-cap players have gone dormant this week. At 484,000 active wallets, the reading is a newfound low in terms of activity for the year 2022. The June 2021 low, with a reading at 505,000 active wallets, resulted in one more shallow move from $35,000 to $31,000. Bitcoin price then commenced a 100% increase in profit between July and November 2021.
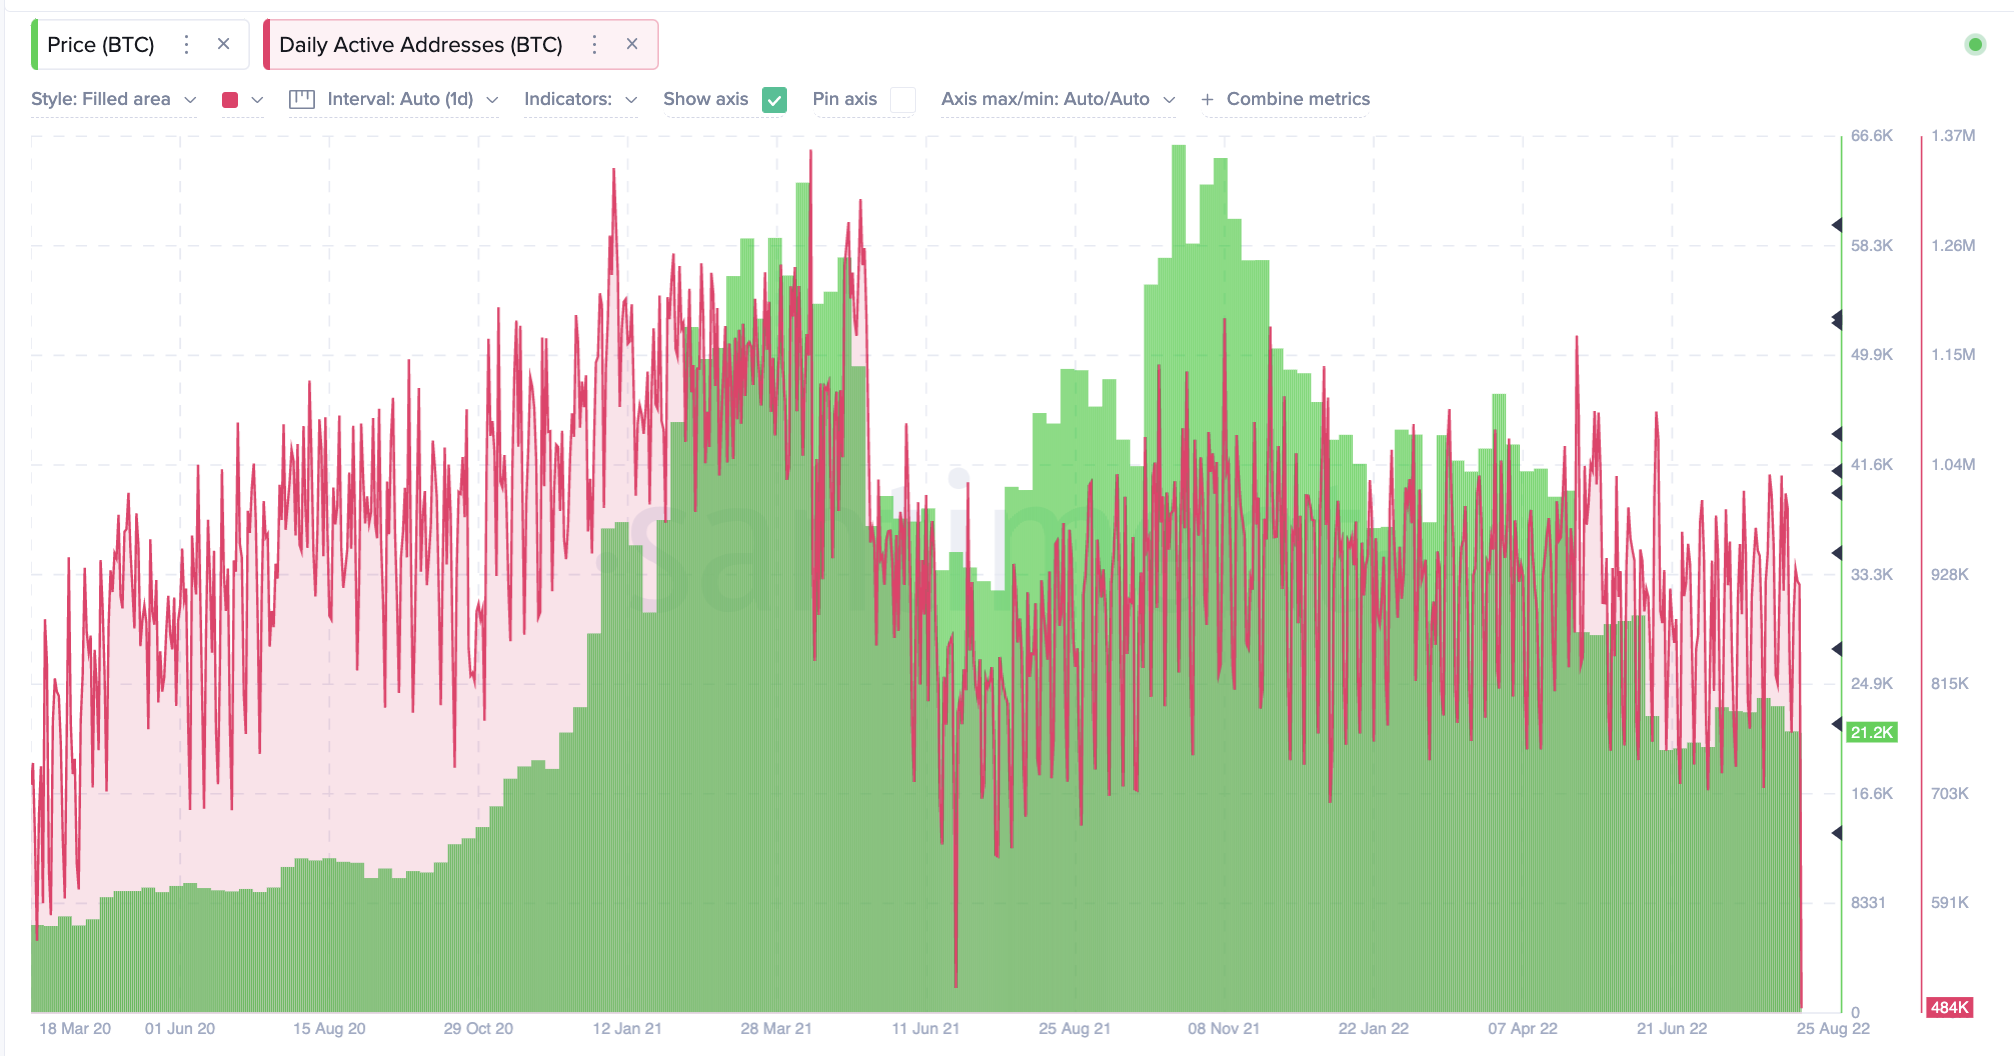
Santiment’s Price & Active Address Indicator
In the following video, our analysts deep-dive into Bitcoin’s price action, analyzing key levels of interest in the market – FXStreet Team
Ethereum price suggests otherwise
Ethereum price currently trades at $1,606. Ethereum has dominated the cryptocurrency sphere in terms of performance, providing several profitable opportunities to latch on to throughout the weeks. The decentralized smart contract token has been a trader’s chart. Still, the textbook-like technicals are not subject to lasting forever. On-chain analysis suggests a very concerning occurrence has just taken place behind the scenes.
Santiments Daily Active Addresses shows the largest influx of active ETH participants this year. At currently $1.08 million, the influx of participants is a third more than 2021’s yearly high reading of 700,000. Just after the 2021 influx occurred, the ETH price fell sharply from all-time highs at $4,500 to $2,400 just weeks later. Historically the indicator narrates that high influxes result in sharp sell-offs. Specifically, the infamous crypto liquidations in both May and December of 2021 and the 2018 all-time highs near $1,400.
When combined, ETH price could set up a catastrophic selloff unspottable for traders solely using technical analysis.
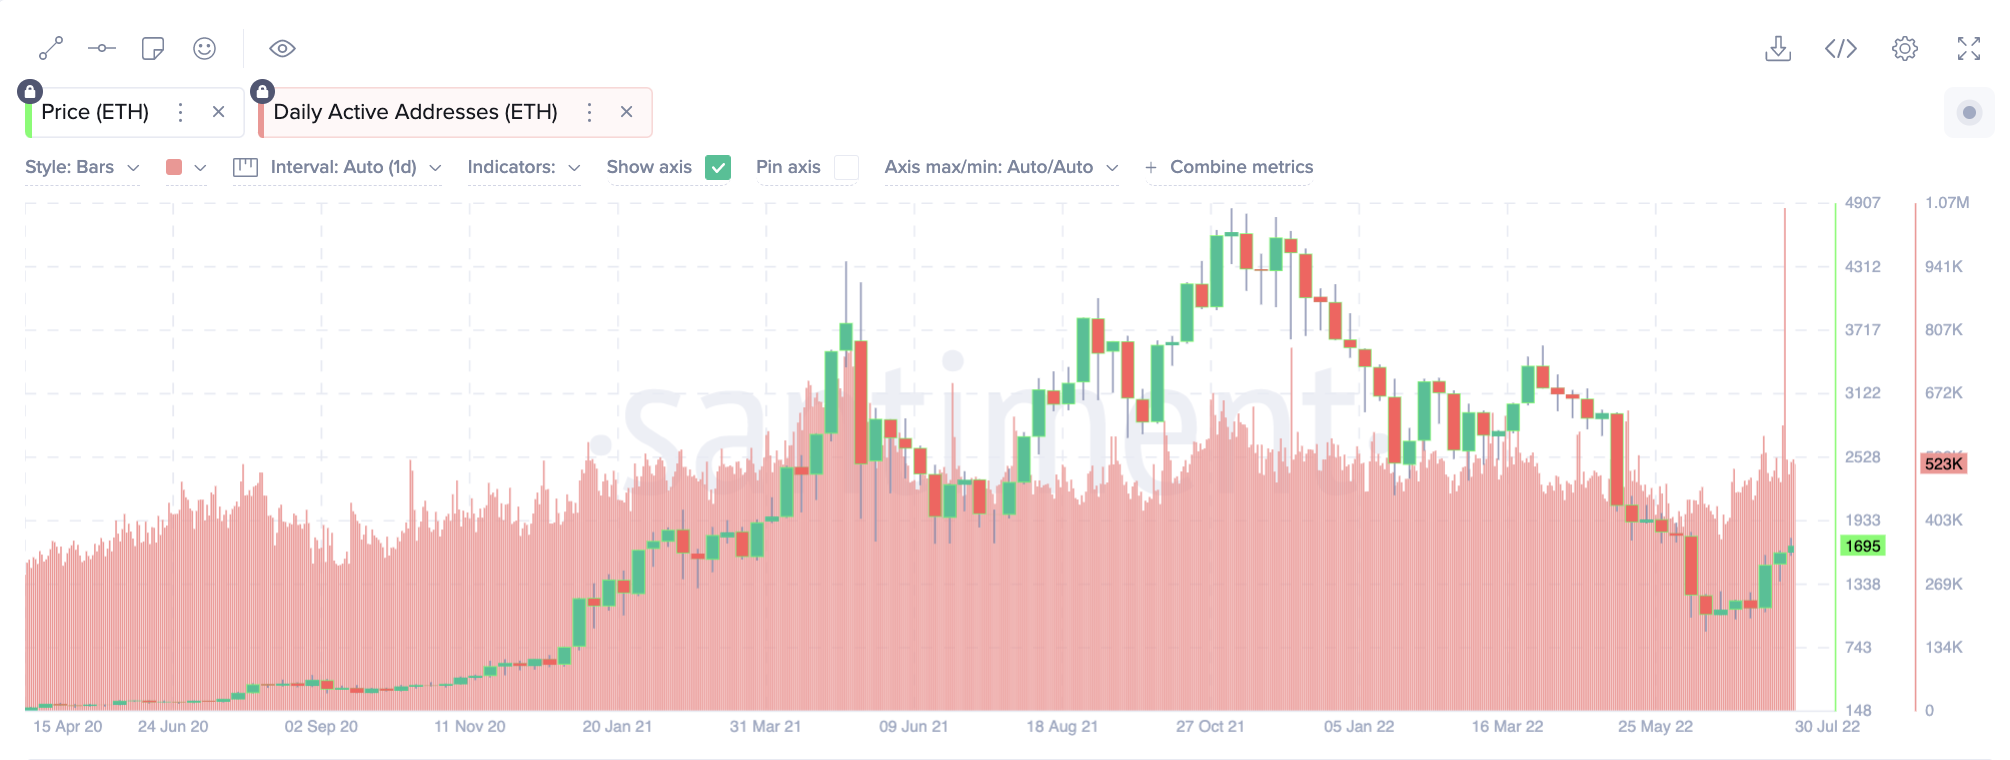
Santiment Price & Daily Active Address Indicator
In the following video, our analysts deep dive into the price action of Ethereum, analyzing key levels of interest in the market – FXStreet Team
XRP price is losing hope already
XRP price has been the underperforming digital asset for most of the summer. The digital remittance token, which saw a 30% increase in price throughout the summer, has already lost 50% of the rallies accrued profit. Now the XRP price hovers above an ascending trend line, providing support throughout most of the summer. A closing candle below the ascending support line could wreak total havoc on the Ripple price.
XRP price currently auctions at $0.34. Unfortunately, there is no on-chain data from Santiment, IntoTheBlock, or Glassnode. Therefore, traders can only utilize classical technical analysis. According to Bitstamp’s exchange, an influx of volume has come into the market near the ascending boundary, which is the first warning signal of mayday. Additionally, the bulls have lost support from the 8- & 21-day simple moving averages.
When put together, the XRP price suggests more decline could occur in the coming days. Therefore, being an early buyer is still ill-advised.
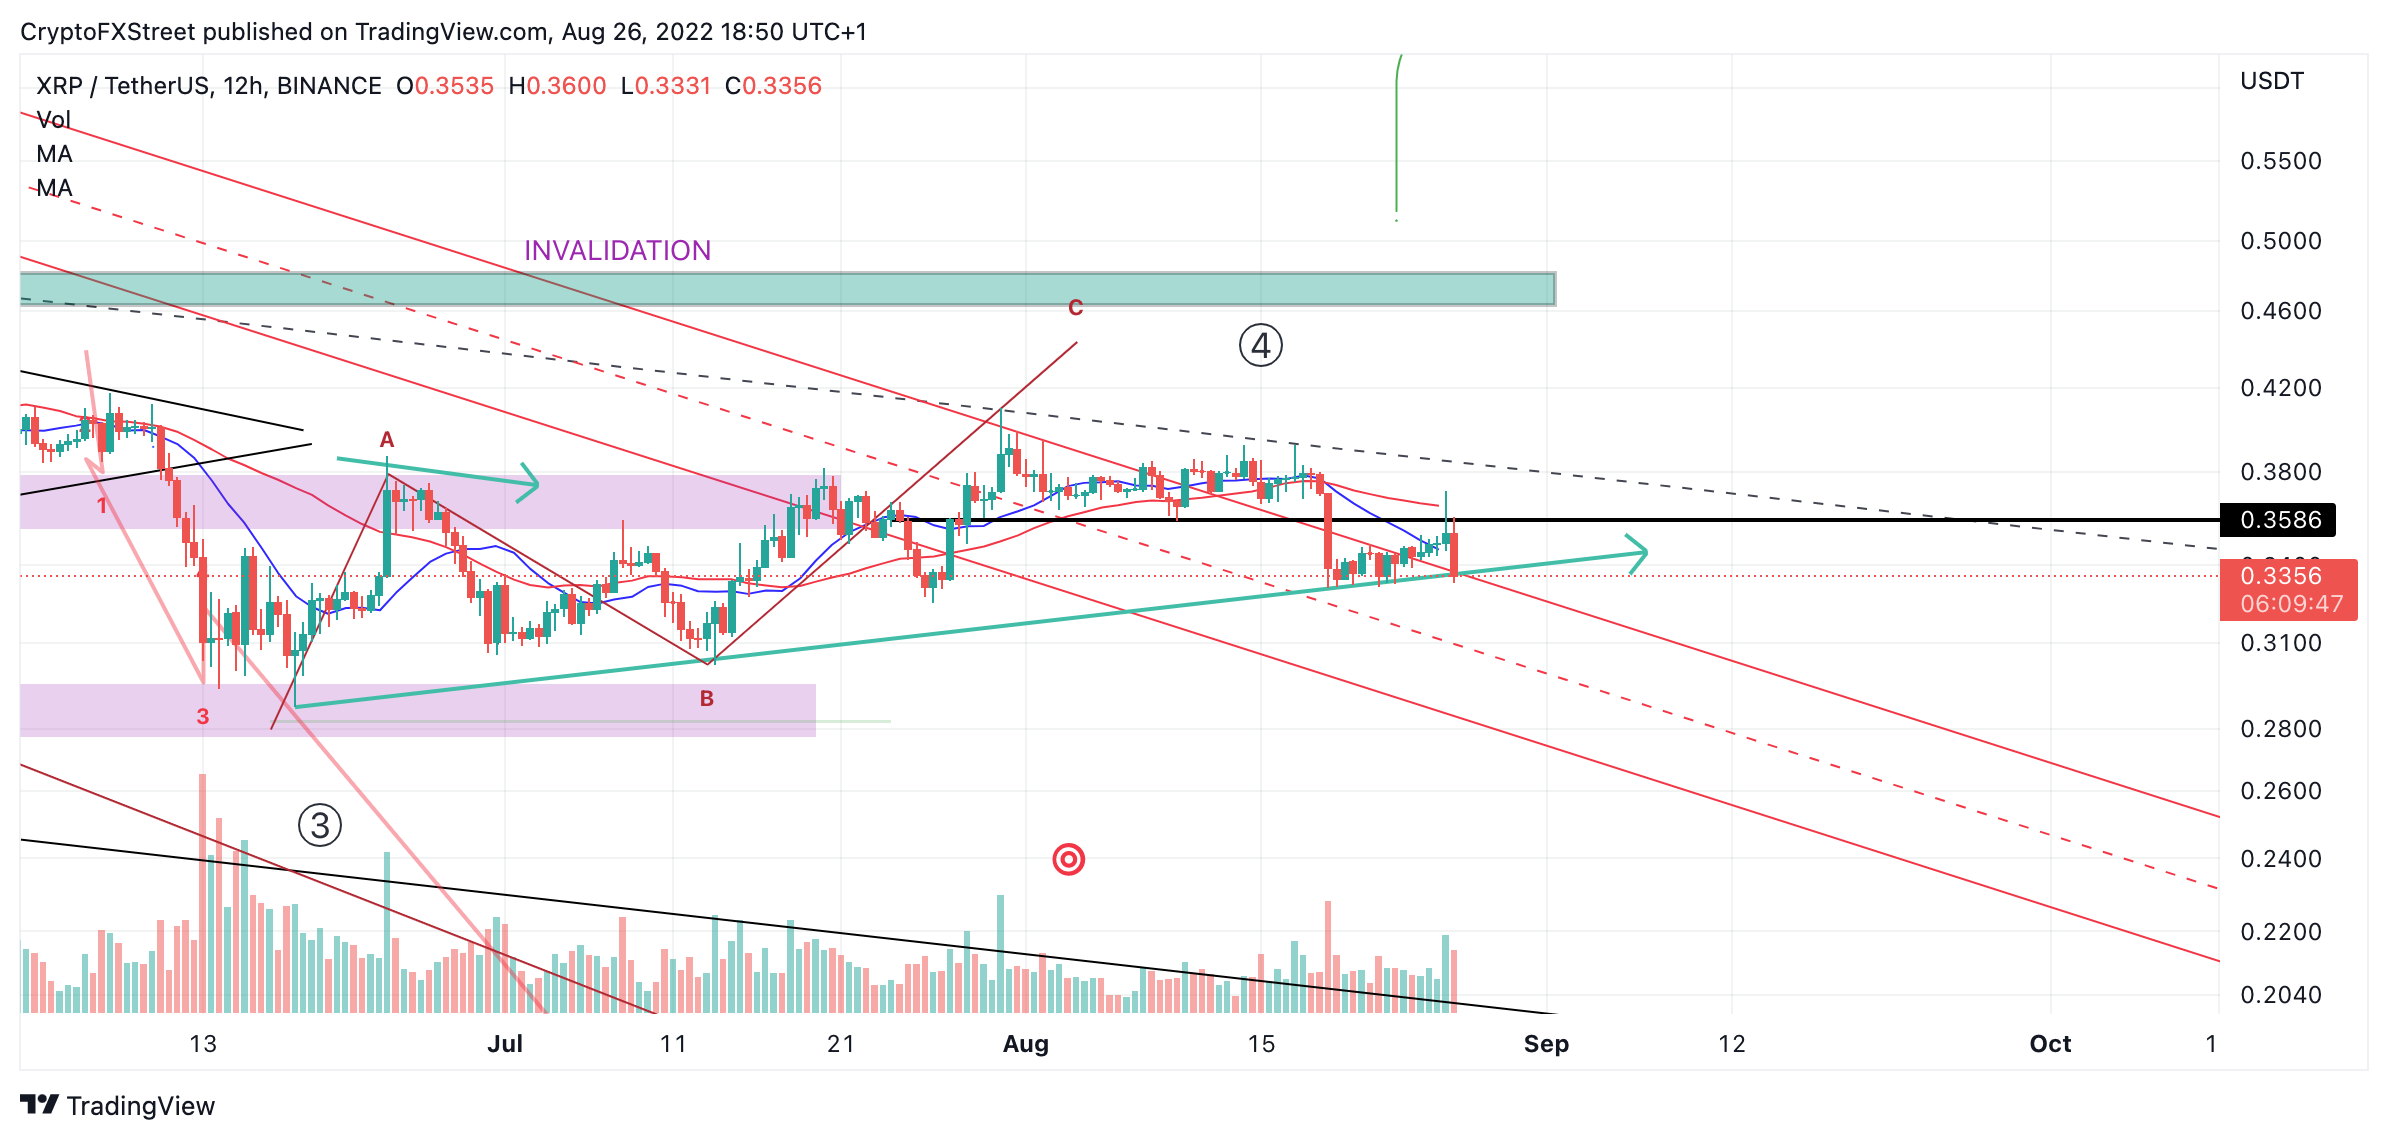
XRP/USDT 12-Hour Chart
In the following video, our analysts deep dive into the price action of Ripple, analyzing key levels of interest in the market – FXStreet Team


 Bitcoin
  Ethereum
  Tether
  BNB
BNB  Solana
  USDC
USDC  XRP
XRP  Dogecoin
  Toncoin