

FTT/USD Stays Below $2.5 Level

Join Our Telegram channel to stay up to date on breaking news coverage
The FTX Token price prediction couldnt move towards the upper boundary of the channel as the coin could settle in consolidation.
FTX Token Prediction Statistics Data:
- FTT price now $2.13
- FTT market cap $607.8 million
- FTT circulating supply 328.89 million
- FTT total supply 328.89 million
- FTT Coinmarketcap ranking #209
FTT/USD Market
Key Levels:
Resistance levels: $10, $12, $14
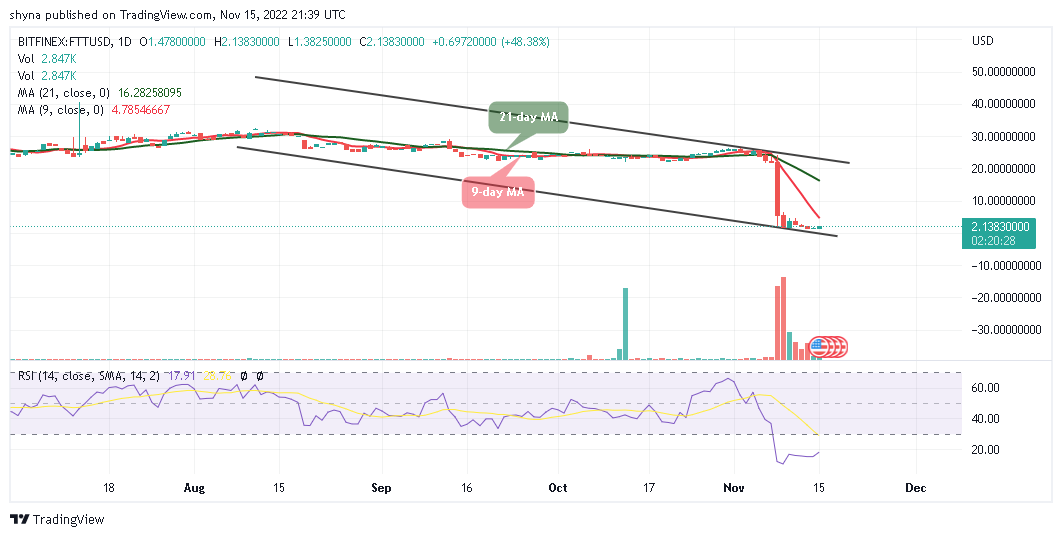
Support levels: $2.10, $1.90, $1.70
According to the daily chart, FTT/USD is pushing for consolidation around $2.15, but the trend has a bearish inclination, which could test the support at $2.0 as it could remain below the 9-day and 21-day moving averages. The technical indicator remained bearish as the Relative Strength Index (14) is seen moving within the oversold region.
FTX Token Price Prediction: FTT Price May Go Higher
The FTX Token price is likely to test the nearest support at $2.0, but the best the bulls can do is to defend the support at this level and focus on pulling towards $5.0. In the past few weeks, the FTX Token lost balance alongside other cryptos, and the sharp drop affected the buyers from an attempted recovery above the moving averages. As it is now, any further bearish movement towards the below boundary of the channel could hit the supports at $2.10, $1.90, and $1.70 respectively.
Moreover, the coin is already trading on average and therefore a slight bullish action is expected to correct the declines with a possible jump above $2.5. Meanwhile, if there is an increase in buying pressure, the price may break above the 9-day and 21-day moving averages to reach the resistance levels of $10, $12, and $14.
Against Bitcoin, the bears are still showing more commitment to trading as the market price remains at the negative signs, therefore, the coin may continue to follow the downtrend as much as the buyers failed to push the price above the 9-day and 21-day moving averages.
Nevertheless, as the signal line of the Relative Strength Index (14) moves within the oversold region, staying there may cause the coin to continue the downward movement to touch the support level of 800 SAT and below, but a rebound above the moving averages could take the FTX Token price to the resistance level of 100 SAT and above.
Join Our Telegram channel to stay up to date on breaking news coverage
