

Ethereum Reaches New Resistance Line: Here’s What to Expect


Ethereum hits one of main resistance lines on daily chart, but it might not break it that easily
Ethereum is finally reaching one of the first resistance lines on the chart that acts as a barrier for assets in the uptrend and downtrend. Besides reaching the resistance, Ethereum could be set for another rally, according to a variety of technical indicators.
Third time is not a charm
Since the beginning of May, Ethereum had tested the 21-day moving average three times and failed to break through due to a variety of factors, including outflows of funds from the cryptocurrency market and increased investment risks.
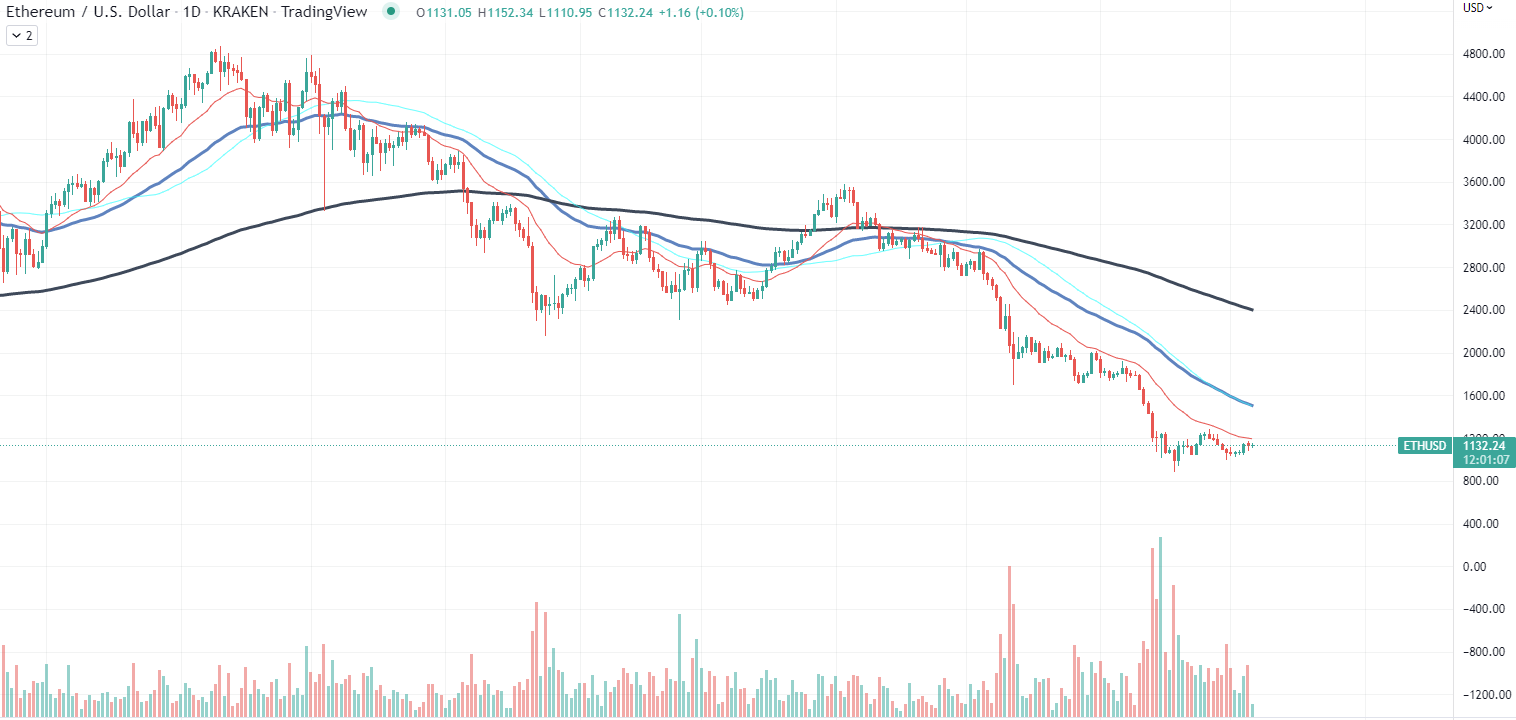
As for now, Ethereum is getting ready for another test that would be the fourth in the last two months. Such a high number of tests of one resistance could indicate that bulls are yet unable to push Ethereum higher because of the lack of inflows on the market.
Some metrics suggest that downtrend is over
The Relative Strength Index on the daily chart is one of those indicators that hint at a reversal on Ethereum. According to the divergence we saw previously, the downtrend on ETH could be over, and what we see now is a consolidation before the recovery rally.
Ads
Another indicator that speaks in the favor of an upcoming retrace is the volume profile that shows a notable fading of the current trend, as the daily trading volume on Kraken exchange hits 13,000 ETH compared to the average of 30,000 ETH.
On shorter timeframes, Ethereum has already broken through numerous resistance lines, including 50EMA on the four-hour timeframe. The successful passage through shorter term resistance is one of the first signs of an upcoming long-term reversal.
At press time, Ethereum is changing hands at $1,130.
