

Ethereum Classic Token CMP at Make or Break Support Zone

- Ethereum classic token over the monthly chart is trading near its critical demand zone while struggling near its important moving average line.
- Currently, the crypto asset is trading below its short to medium term moving averages of 20, 50 and 100-DMA lines and trying to hold its 200-DMA line.
- The pair of ETC/BTC is trading at 0.001109 BTC with a 24-hour loss of -4.45%, and the ratio of ETC/ETH is CMP at 0.0162 ETH with a minor intraday dip of -0.74%.
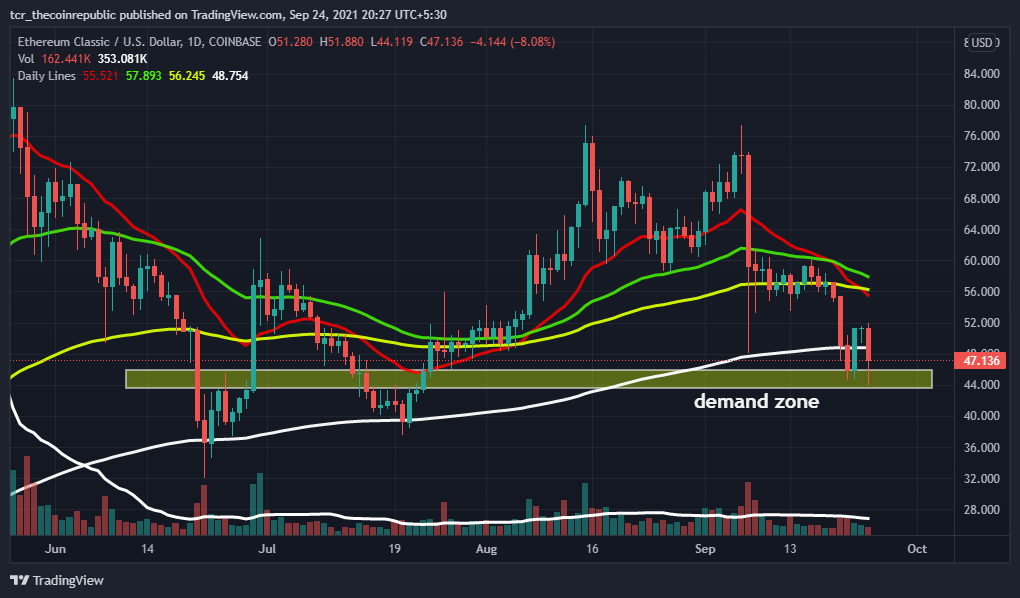
Ethereum classic token is trading near its major demand zone after witnessing a sharp decline from the higher levels. Moreover, the crypto asset is trading below its short to medium term moving average of 20, 50 and 100-Day lines. The digital asset presently reaches near its medium-term demand or support area, with lower volume activity.
The major thing to watch for bulls is the sustainability of token above its demand zone, with supportive volume action. Likewise, if the coin fails to hold its support zone and falls below it, we can see more downside in upcoming sessions. For a substantial reversal, the token must sustain above its 200-DMA with a good volume activity. Support on the lower side is $43.80 and $38.50, whereas resistance on the higher side is $55.70 and $61.90.
Ethereum classic token is trying to rebound after a dip from higher levels
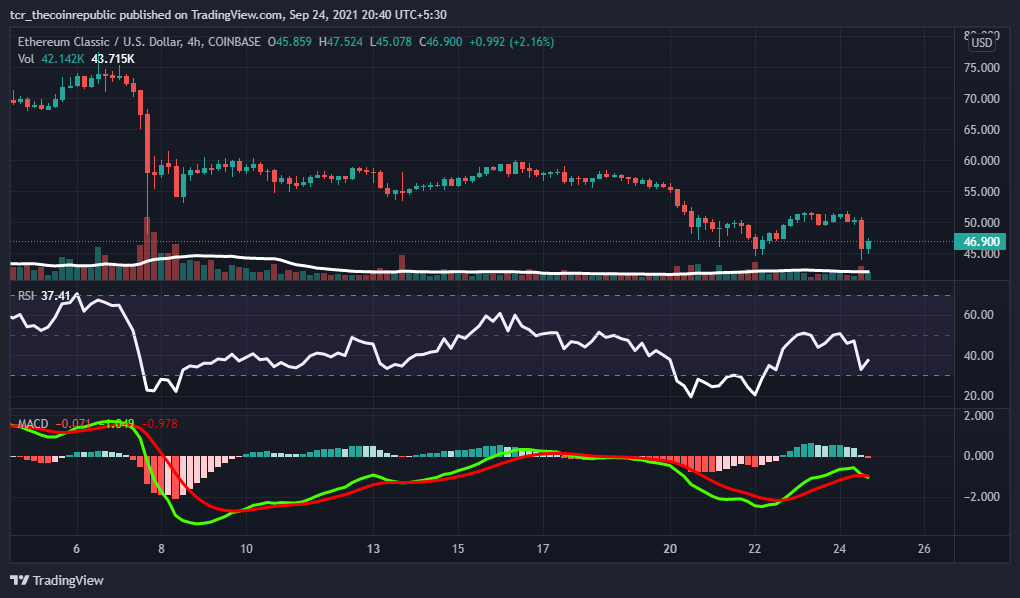
Ethereum classic token at the weekly chart is trying to rebound after a sharp dip from the higher levels. In comparison, the technical parameters are also tested in its oversold region. Volume over the 4-hour time frame is lower and needs to grow strongly for a positive, sustainable rally. ETC token is trading at $46.75 with an intraday drop of -8.39%, and the volume to market cap ratio is at 0.1644.
Relative Strength Index (NEUTRAL): Ethereum classic token RSI is trying to rebound over the weekly chart. In contrast, the RSI is trading flat after testing the oversold zone and CMP at 36.
Moving Average Convergence Divergence (NEUTRAL): The daily chart indicates a neutral trend at the 4-hour time frame. At the same time, the buyer’s signal line (green) and the seller’s line (red); are overlapping each other.
Support levels: $43.80 and $38.50
Resistance levels: $55.70 and $61.90.
.
