

Ethereum Classic Moves in a Downtrend; Will ETC Rise?

Ethereum Classic is trading in a downtrend routine as the price reduces and reaches its lows. The price has been revolving at the Support Line for the past 2 weeks. The remote price movement creates indecision between the bears and the bulls. The current weekly candle hasnt yet closed above the recent high of $27.
The ETC price even suppressed the up-trend line stretching over from February end, thus denoting a bearish momentum of the token. The token forming lower low peaks on the weekly chart show a strong downtrend market over the past few weeks. The token moves at a vital point from where the price can move in any direction. Check Ethereum Classic price prediction to know the future price movements of the coin.
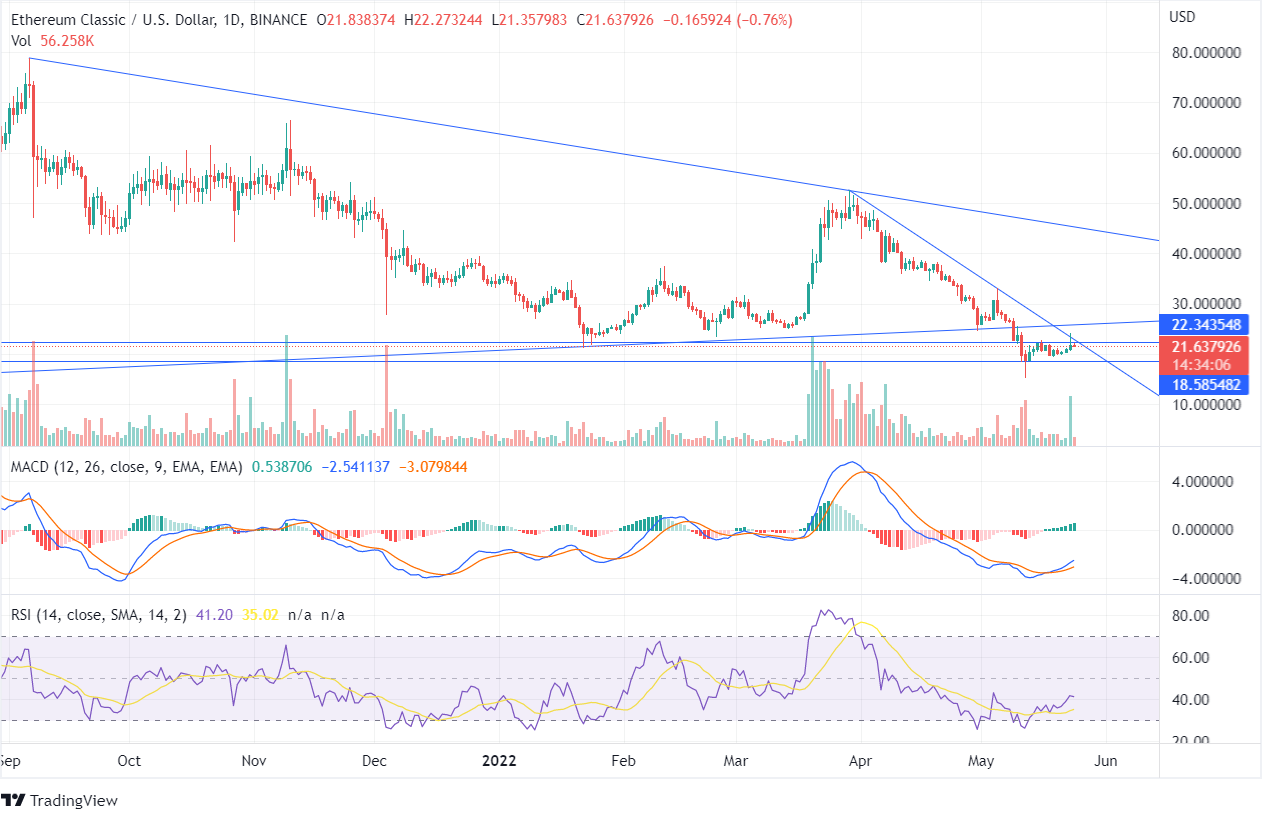
The ETC price is turning from the bottom horizontal line of $18 and is moving sideways in consolidated momentum on the daily chart. The price is moving below the downtrend line. On May 23, even when the bullish candle was formed with immense volume, the ETC price couldnt climb upwards.
The MACD line is trading above the Signal Line, indicating a bullish signal. The RSI is 41 and has moved in the overbought zone, and the ETC price is currently moving below the horizontal lines in the support zone.
The investors can expect a downtrend to continue if the token closes below the recent low of $18. However, if the token closes above the downtrend line or closes above the recent high of $24, a bullish momentum can be hoped.
