

DOT/USD Market May Continue Downwards

Join Our Telegram channel to stay up to date on breaking news coverage
Polkadot price action began its downtrend around the 13th of last month (August). However, there was a pause in the downtrend when it reached strong support. At this point, price action seems to be shaping to break this support.
Polkadot’s Analysis Statistics Data:
DOT’s value now: $6.3
DOT’s market cap: $7.20 billion
DOT’s moving supply: 1.12 billion
The Total supply of Polkadot’s: 1.24 billion
DOT’s Coinmarketcap ranking: #11
This analysis will further examine the possibility of the downtrend continuation, or an upward reversal. We’ll also extend this analysis to cover the DOT/BTC market.
Crucial Price Marks:
Resistance Marks: $6.50, $7.00, $7.50
Support Marks: $6.34, $6.00 $5.70
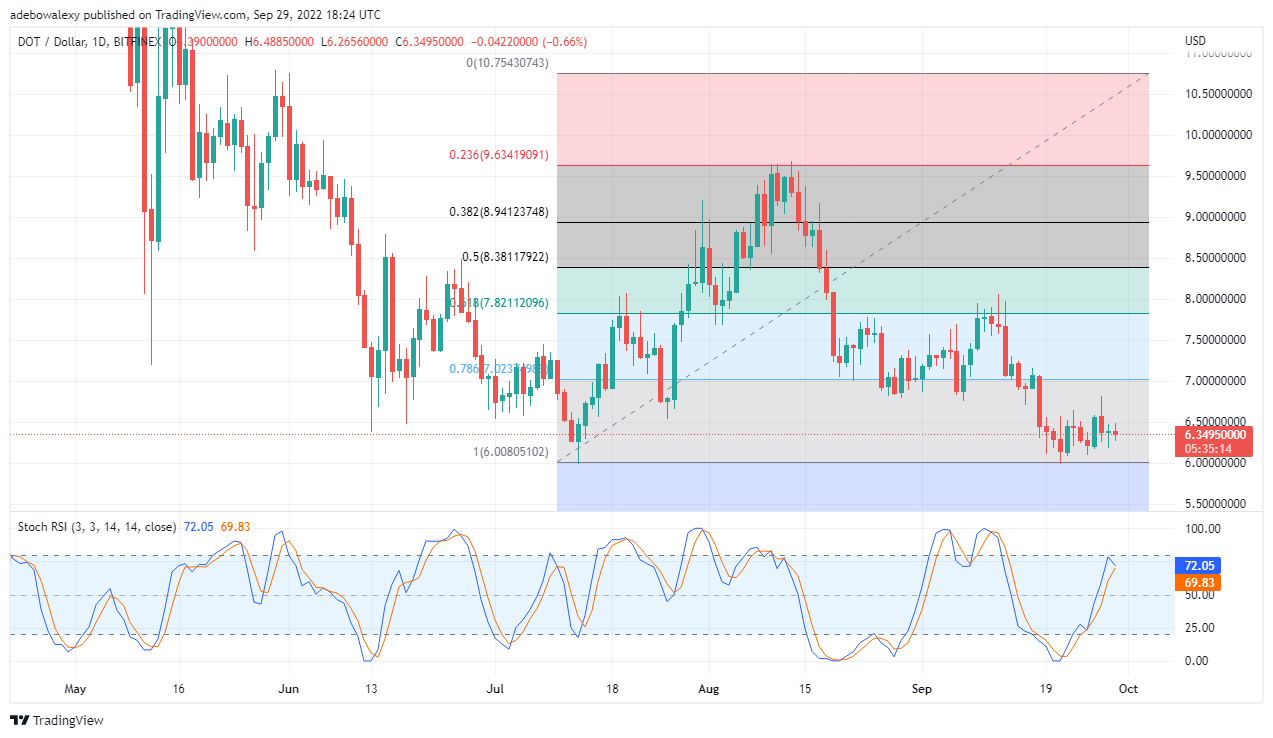
Polkadot Price Analysis: DOT/USD May Continue Its Downtrend
Studying DOT/USD 24-hour chart, we can see that price activity experienced a pullback as soon as it reached the 100 Fib level. There was a sharp correction in price, which took some days before it was canceled out. Additionally, the Stochastic RSI has reached the oversold even when bearish candles were more in number. Also, the lines of this Indicator are now shaping to Indicate a downtrend at the 72% and 70% levels. There are two possibilities here once the downtrend starts, the price of Polkadot may break down the 100 fib level to the extension. Also, should the 100 Fib level continues to hold price may continue its consolidation move. However, it is more likely for the price to fall below the $6.00 level going by the RSI display.

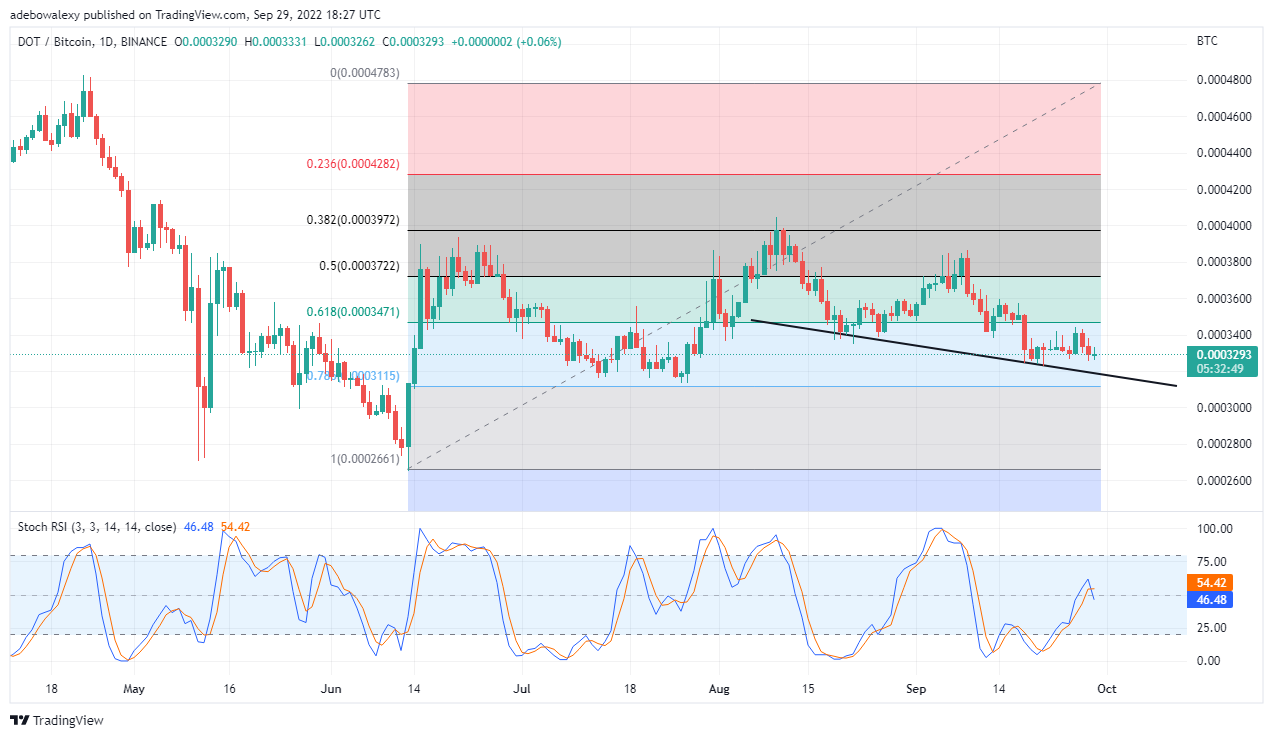
Polkadots Price Analysis: DOT/BTC Market Trades in a Steady Downtrend
The DOT/BTC market portrays that price action is proceeding on a smooth downtrend, which started around 13 August. Furthermore, the size of the last candlestick on the chart hasn’t been able to cause a significant upward change in price activity. Consequently, this portrays that sellers are more likely to cause price action once touch the downward sloping support.
Buy Polkadot Now
Your capital is at risk.
Furthermore, the Stochastic RSI lines have crossed each other at the 54% and 48% levels. Consequently, we can expect the price to touch on the slopping support once more. Therefore, traders can expect the price to arrive near 0.0003200 soon.
Tamadoge – Play to Earn Meme Coin

- Earn TAMA in Battles With Doge Pets
- Maximum Supply of 2 Bn, Token Burn
- Now Listed on OKX, Bitmart, Uniswap
- Upcoming Listings on LBank, MEXC
Join Our Telegram channel to stay up to date on breaking news coverage
