

Cryptos manipulation proves decentralization is a myth

- Bitcoin traps break out buyers once again this month.
- Ethereum price is on pace to fall lower on the Volume Indicator.
- XRP price is still submerged and likely to plummet.
Bitcoin price traps bullish traders once again
Bitcoin price saw a false breakout on Monday as the price optimistically rose above $31,500, only to be furiously rejected by the bears shortly after. FXStreet’s very own analyst Akash Grimath warned of the potential fake-out on his Twitter account while dually forecasting a 5-1 trade setup for the bears.
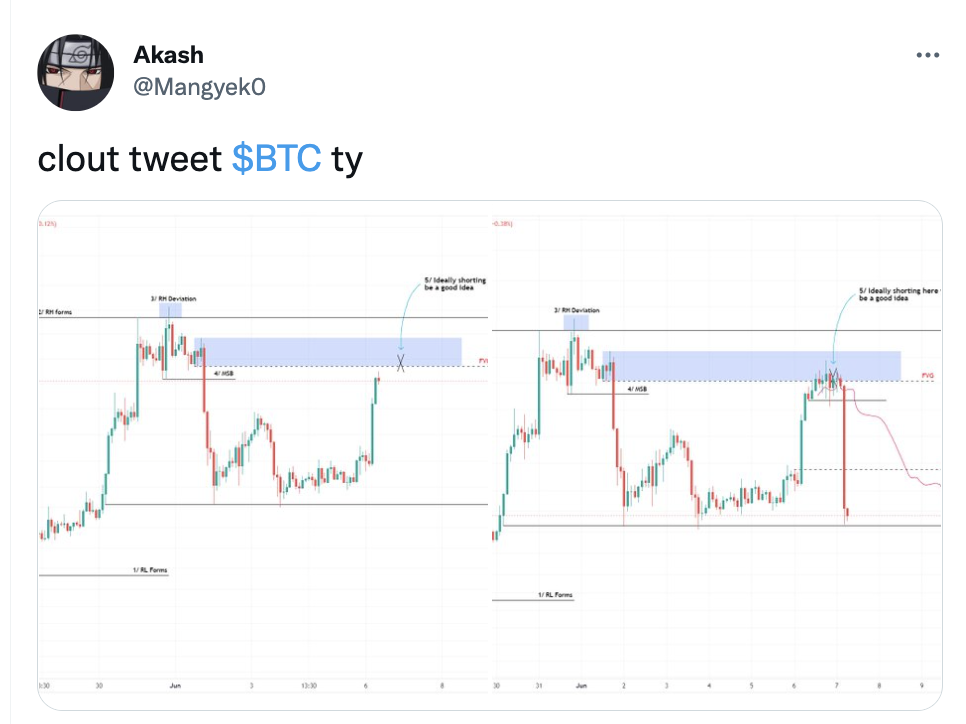
Twitter:@Mangyek0
Bitcoin price fell within hours of the bearish forecast issued by Akash and now trades again at $29,849. Such a devastating liquidity trap can only spell for more declines as retail traders are likely to capitulate after the first day of trading. BTC price will likely test the patience of all bullish traders in the market, do not be surprised if the lows at $26,750 are breached.
Invalidation for the bearish thesis is a breach above $31,500. If $31,500 is breached, expect $34,000 as the next probable target resulting in a 15% increase from the current Bitcoin price.
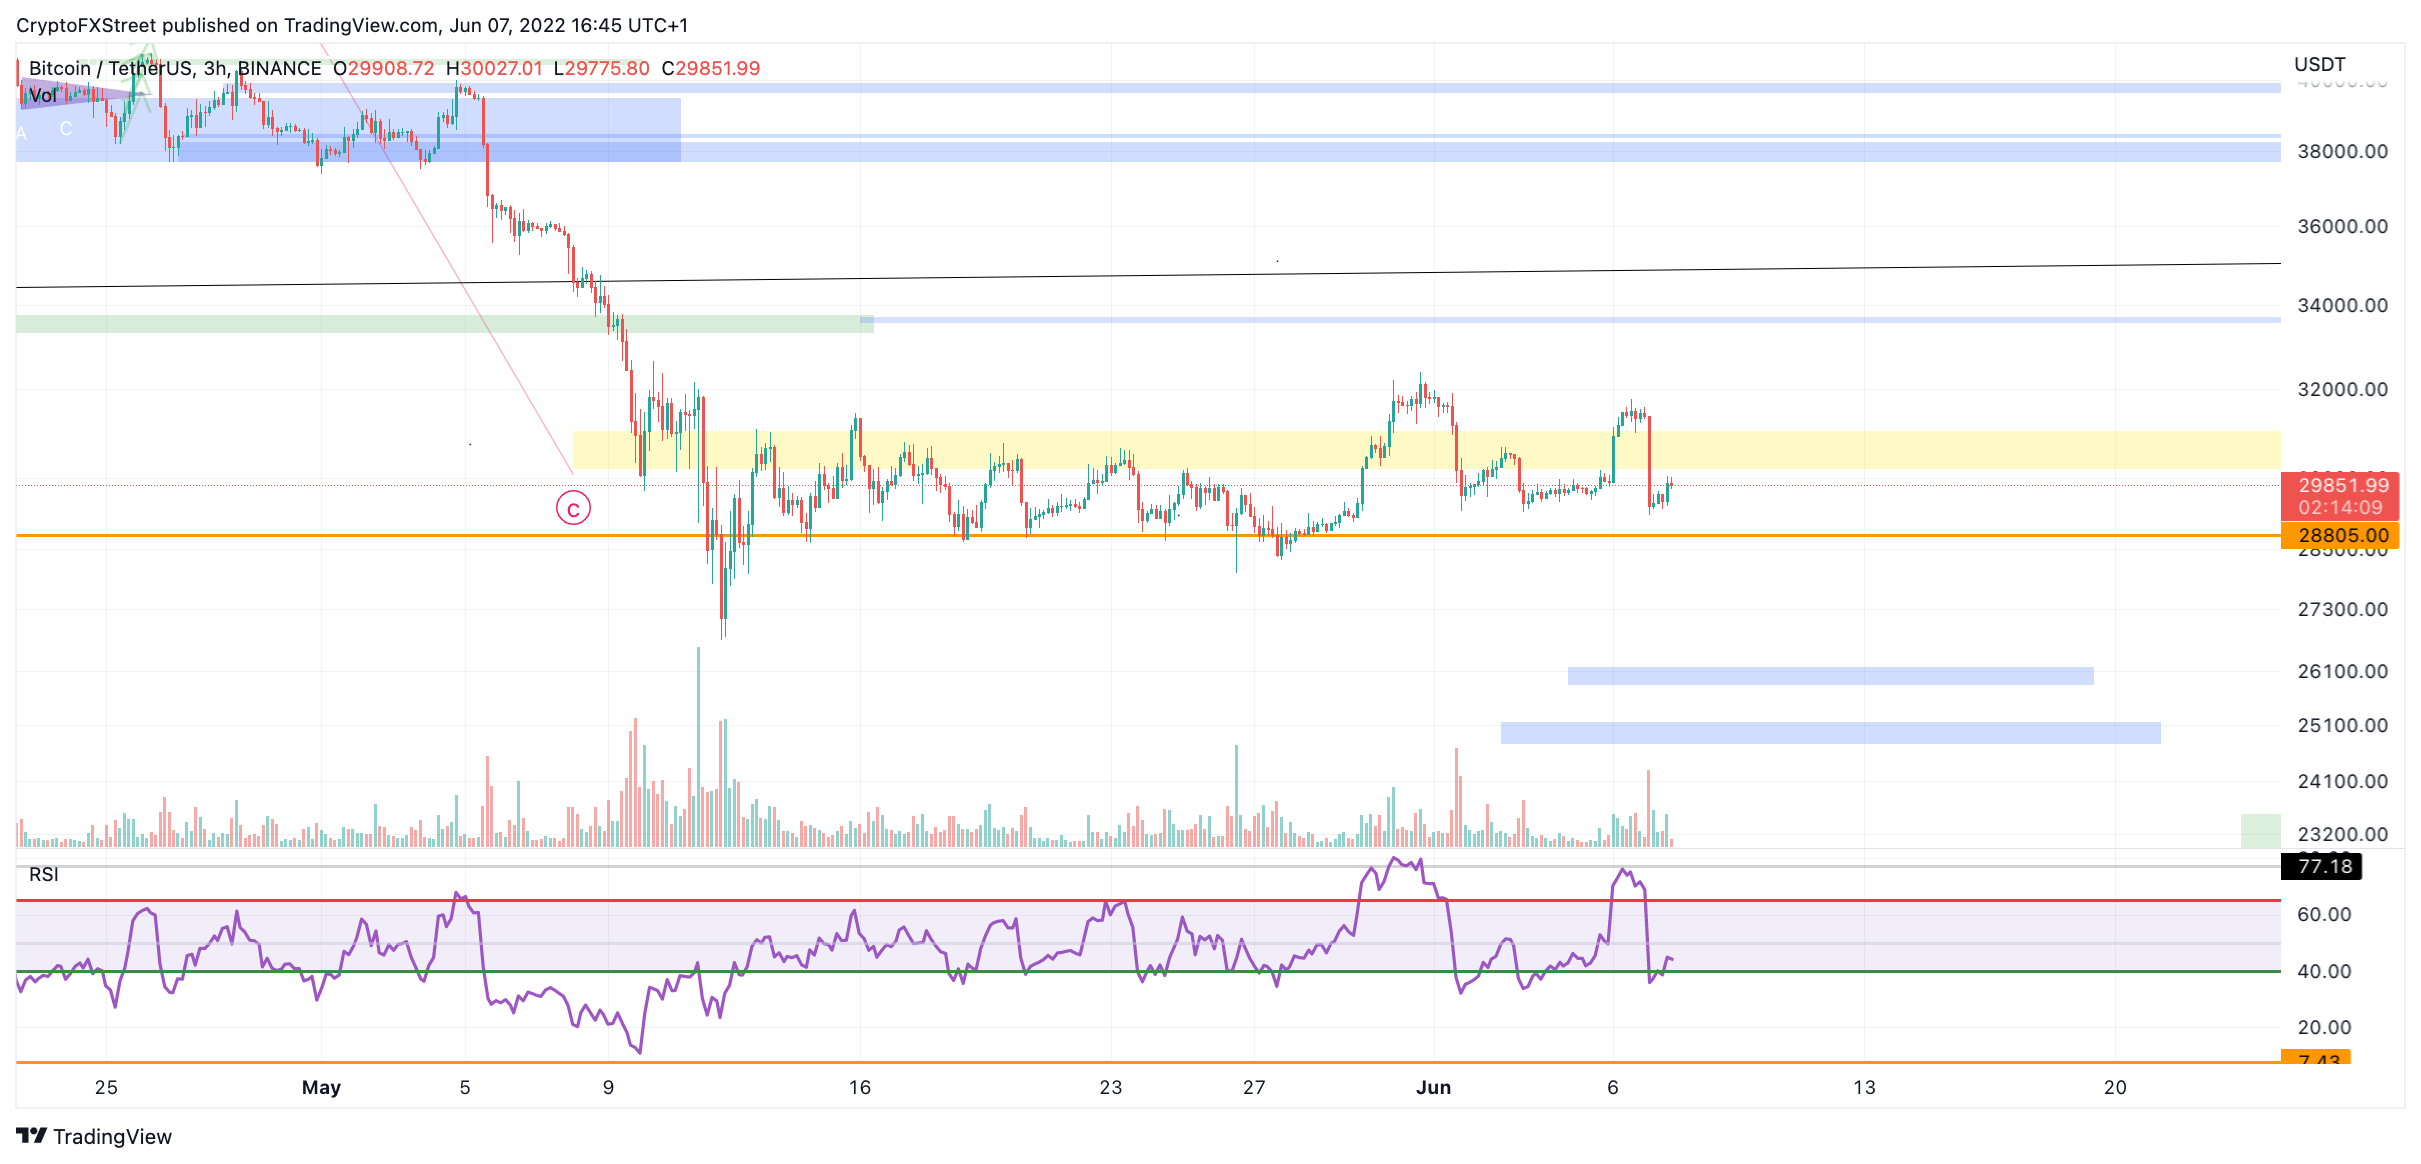
BTC/USDT 3-Hour Chart
Ethereum price is poised for failure
Ethereum is setting up for a devastating plummet into the $1,300 price level. The coiling-like pattern accompanied by the Volume Profile indicator shows significant bearish involvement. The bulls are likely to throw in the towel early as they may have bought the previous lows on May 28 at $1,700. Traders unaware of the bearish demonstration should consider adjusting any open positions to a potential 30% decline.
Ethereum price is deemed a high-risk asset until lower targets are reached. Invalidation for the bearish thesis is a breach above the triangle’s origin point at $2,179. If $2,179 is breached, expect more gains into $2,400, resulting in a 35% increase from the current Ethereum price.
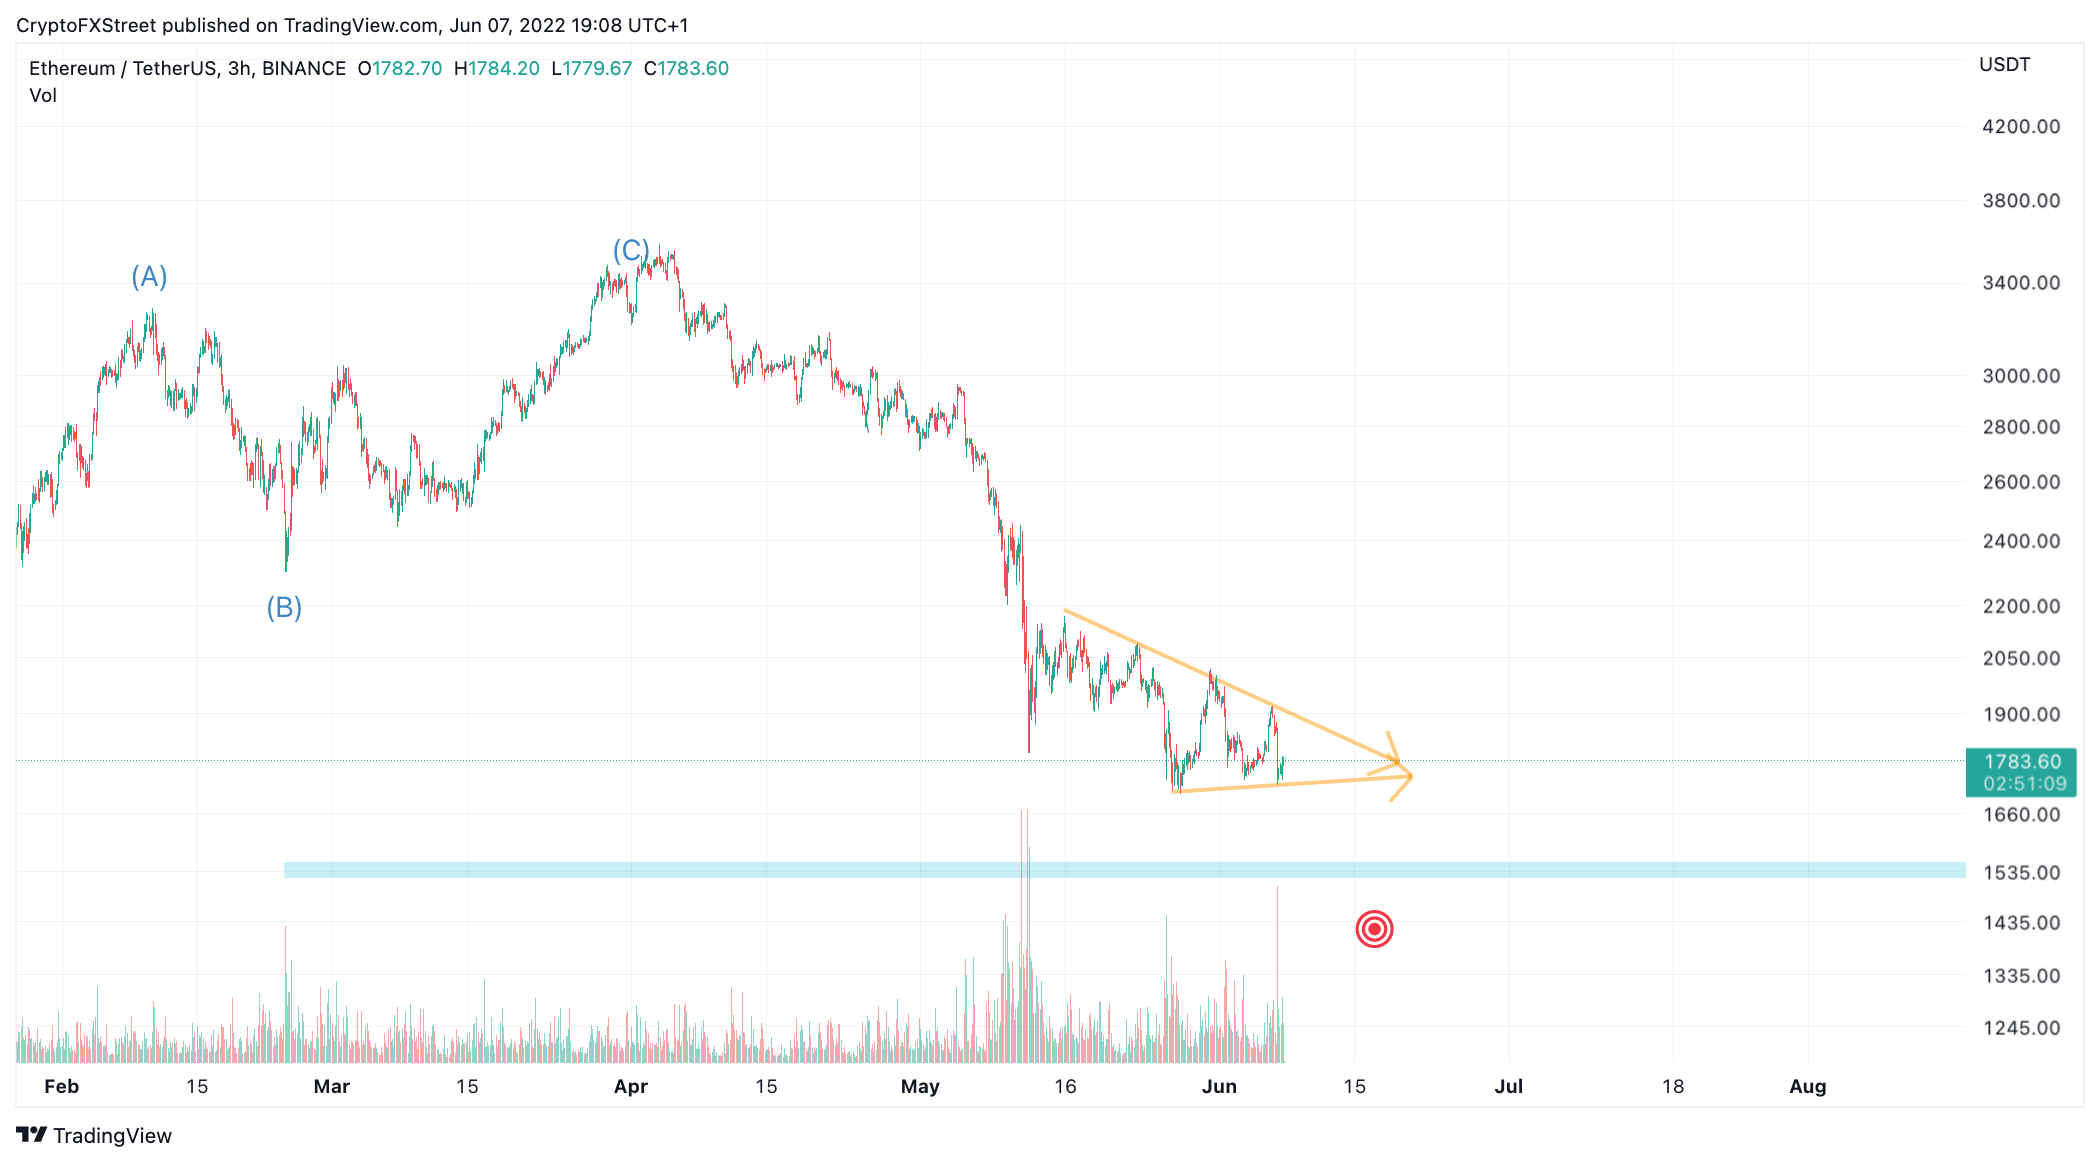
ETH/USDT 3-Hour Chart
XRP targets $0.30
XRP price forecasts a 25% decline to $0.30 in the coming days. The wedging-like pattern will likely be the catalyst before the next volatile trend change occurs. The lack of bullish involvement within the pattern could be indicative of smart money’s unwillingness to negotiate at the current $0.39 level.
XRP price has seen better days and could be too risky to trade at the current time. In fact, the crypto markets’ consistent failure over the last ten weeks provokes crypto advocates’ core idea of decentralization as nearly all cryptos seem to be highly correlated and respondent to Bitcoin, Nasdaq 100 and geopolitical news events.
Nonetheless, risky traders should wait for a breach below $0.365 before entering on the short side. Invalidation of the bearish thesis is a breach above $0.42. If $0.42 is breached, expect a 25% rally in the other direction towards $0.51.
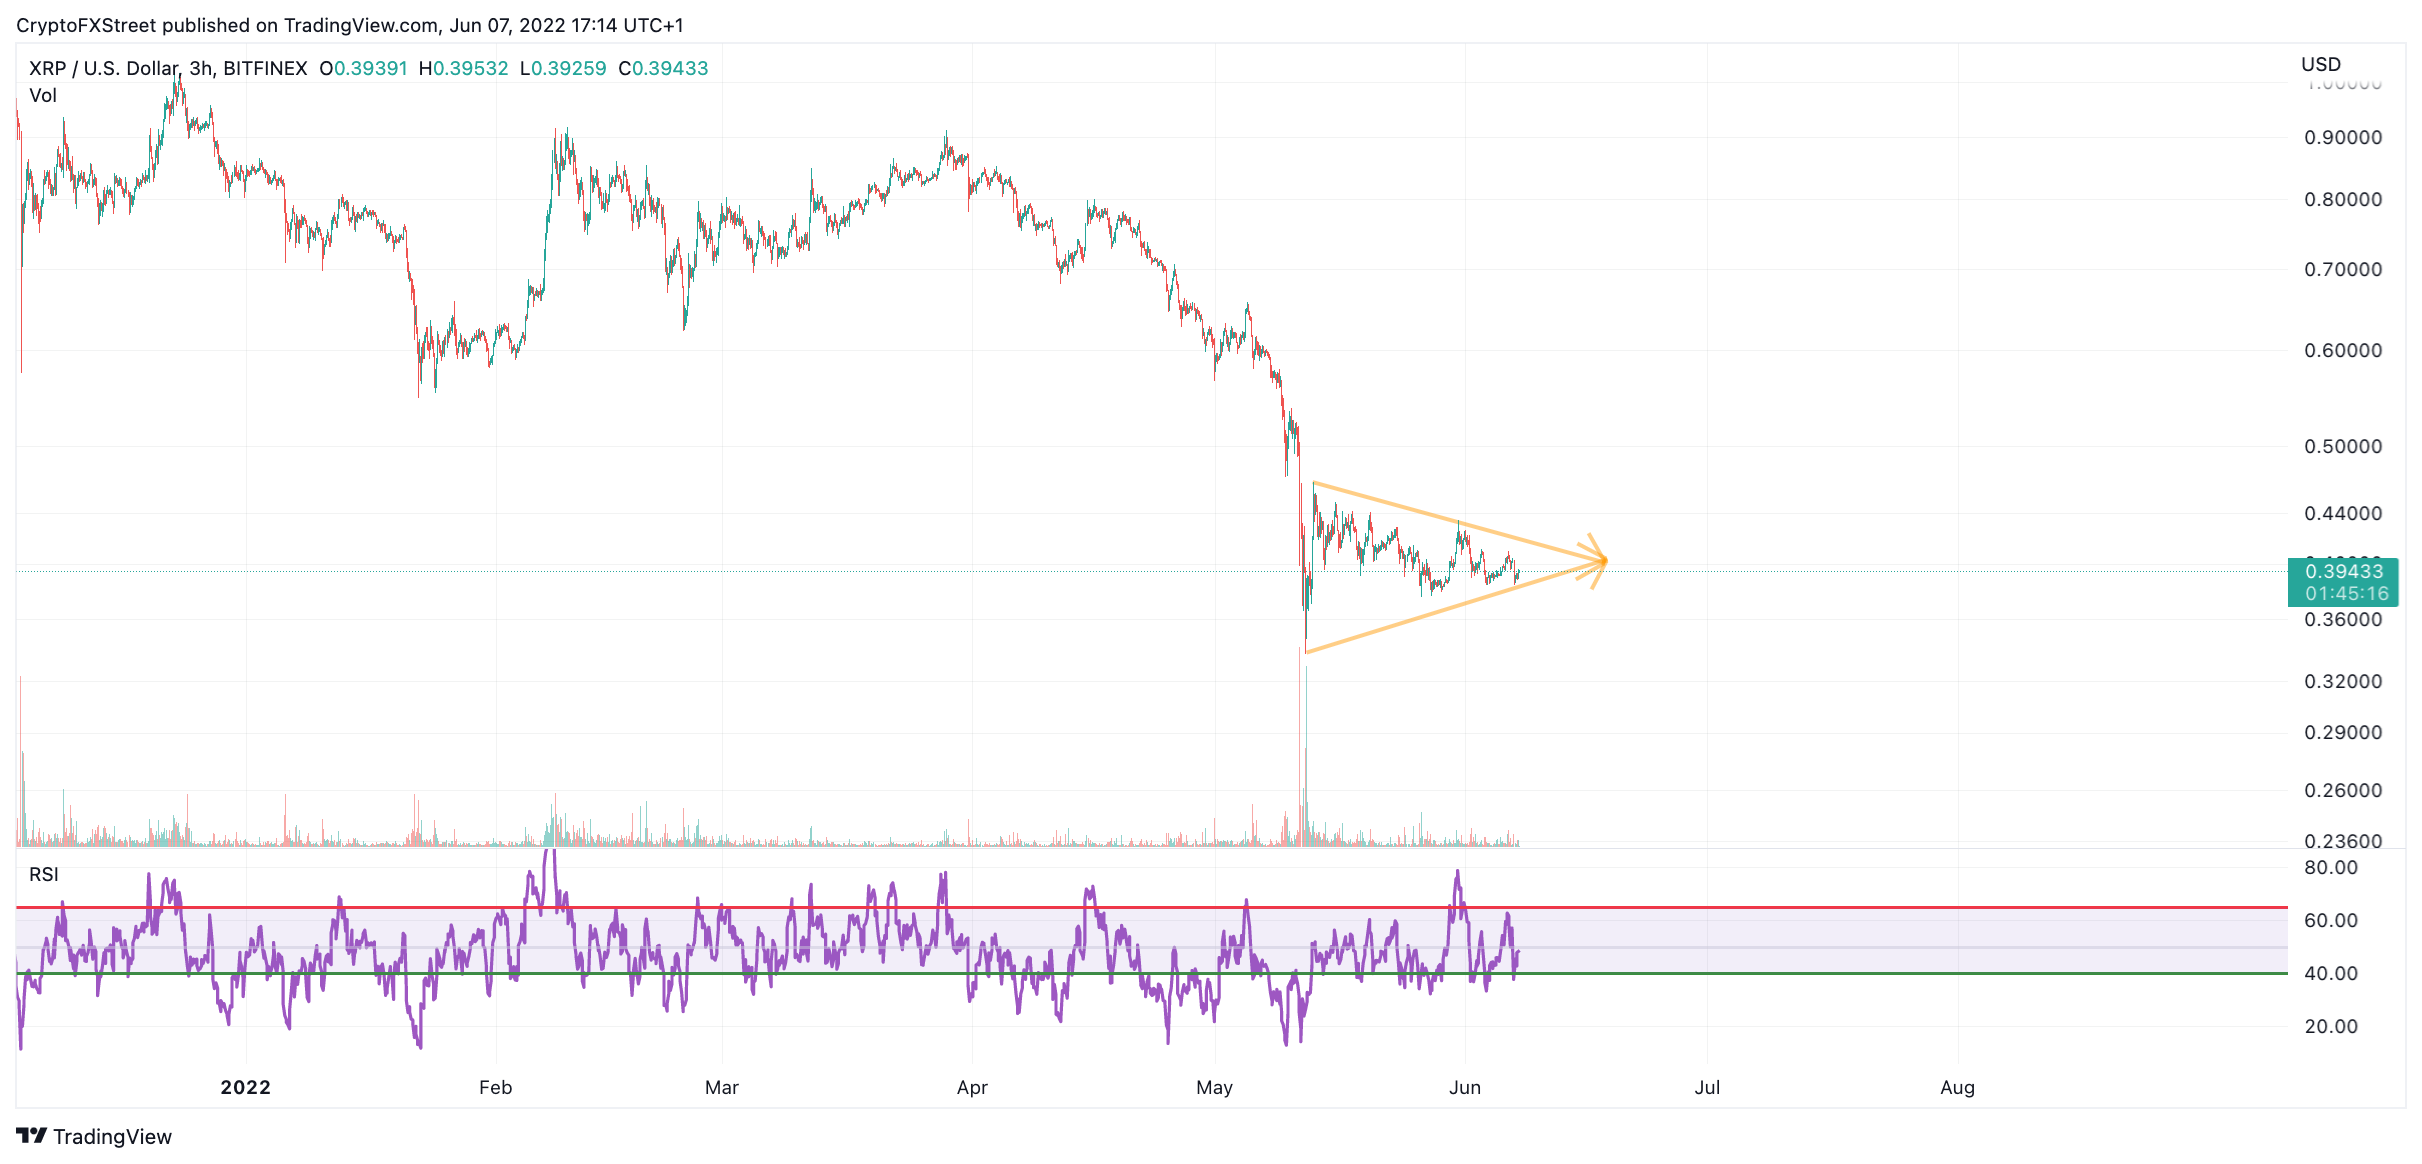
XRP/USDT 3-Hour Chart
