

Crypto markets hope for a better outcome amid multiplying hurdles
- Bitcoin price plans its recovery after a breakdown from the bear flag setup last week.
- Ethereum price continues to follow BTC’s footsteps but is still stuck trading between $1,423 and $1,280.
- Ripple price prepares for a bounce off the $0.462 support level but awaits the big crypto’s signal.
Bitcoin price shows a lack of volatility after the Consumer Price Index (CPI) announcement on October 13. The weekend was lackluster and did not produce any significant moves, however, the Asian session seems to be taking an interest in pushing BTC higher, which could result in Ethereum, Ripple and altcoins rallying.
Bitcoin price to establish directional bias for this week
Bitcoin price broke out of the bear flag setup on October 10 and triggered a 12% downswing forecast to $17,088. While the first few hours of the Asian session seem to be slightly bullish, a continuation of this trend would require BTC to flip the 20-day Exponential Moving Average (EMA) at $19,521.
This development will open the path for Bitcoin price to retest the $20,036 to $20,737 zone. Monday’s range is likely to form between the current position and that zone.
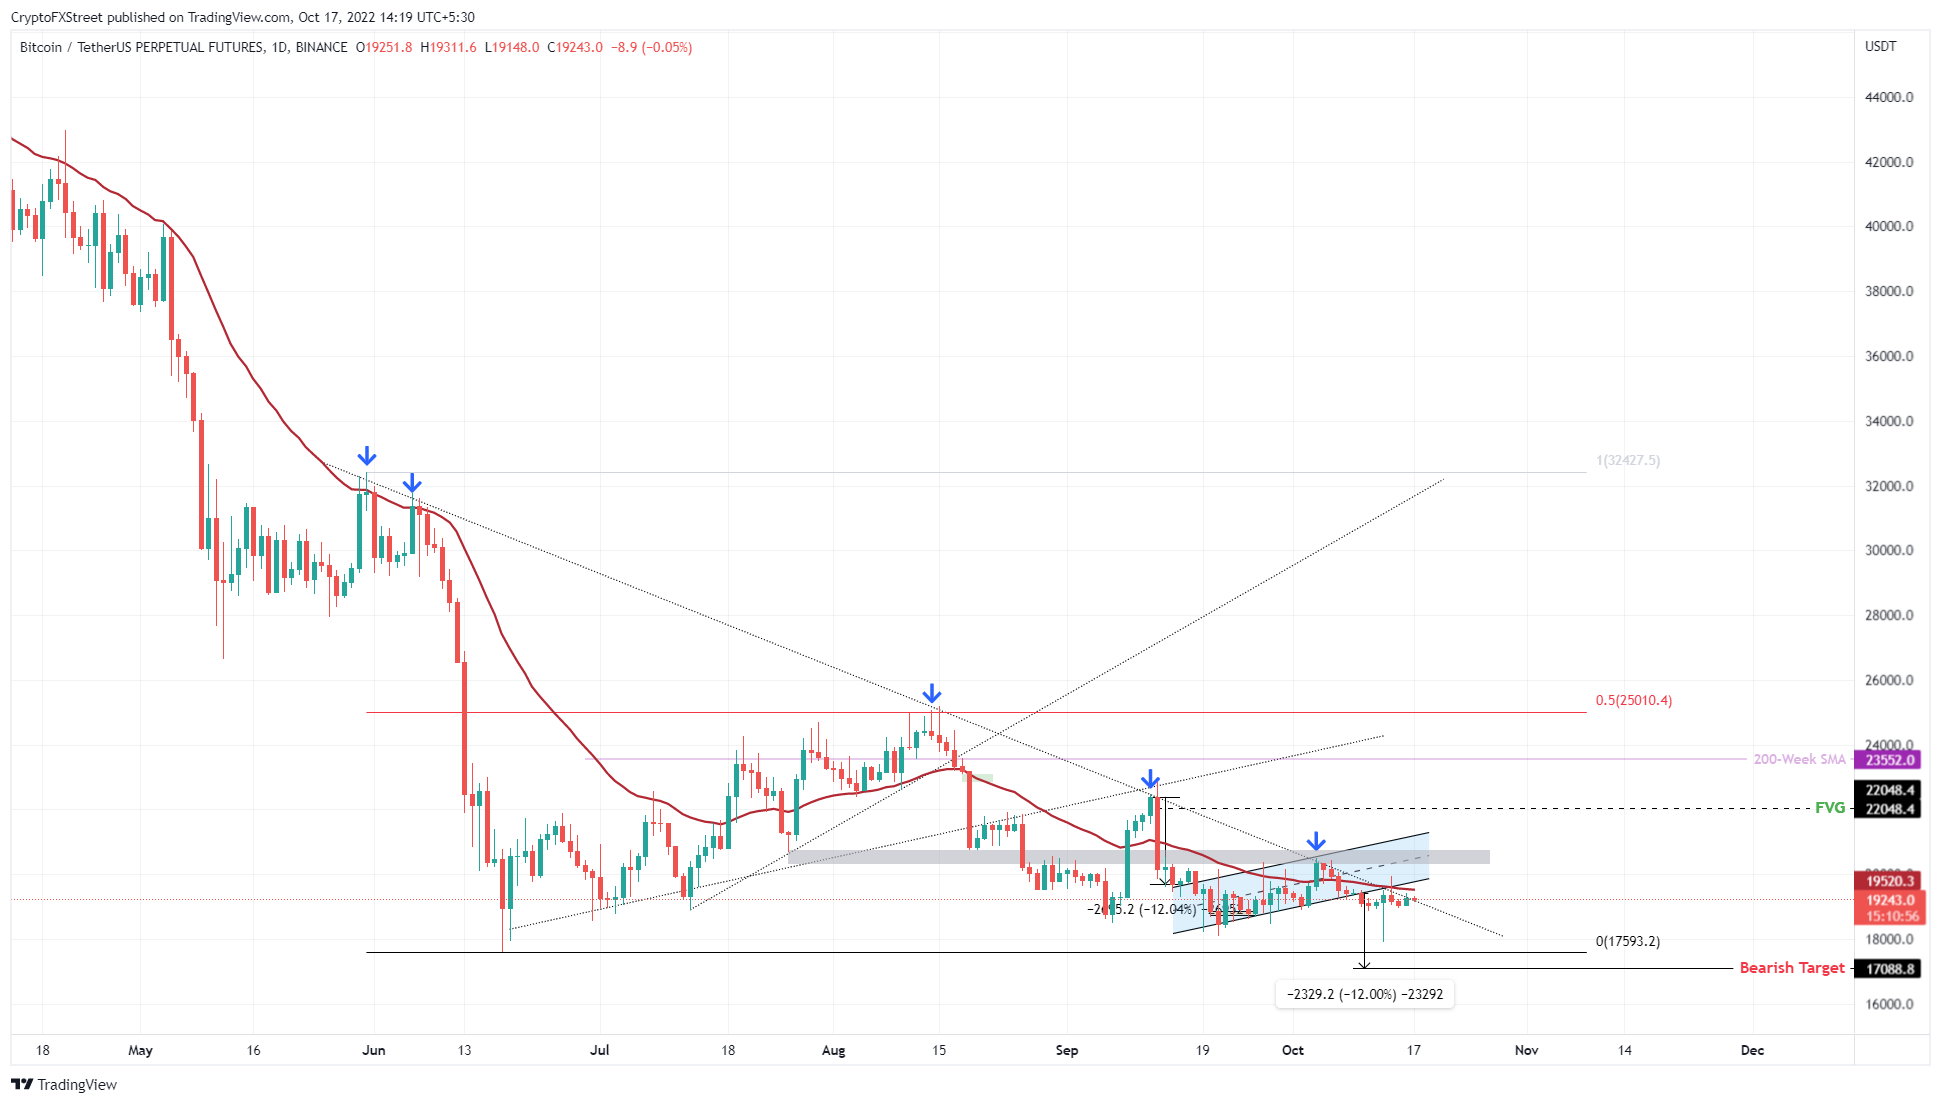
BTC/USD 1-day chart
On the other hand, if Bitcoin price fails to move past the 20-day EMA at $19,521, it will indicate a lack of buying pressure. On the other hand, a breakdown of the $19,000 psychological level would result in a sell-off that could potentially sweep June 18 swing low at $17,593.
Ethereum price waits for a signal to move
Ethereum price has been stuck between the $1,440 hurdle and the $1,280 support level for nearly a month and still shows no signs of a breakout. If Bitcoin price rallies higher to set up Monday’s range, investors can expect ETH to follow suit and revisit the $1,400 psychological level.
A flip of the aforementioned level into a support level is unlikely without the support of Bitcoin price. In the event that it does, Ethereum price could tag the $1,559 hurdle.
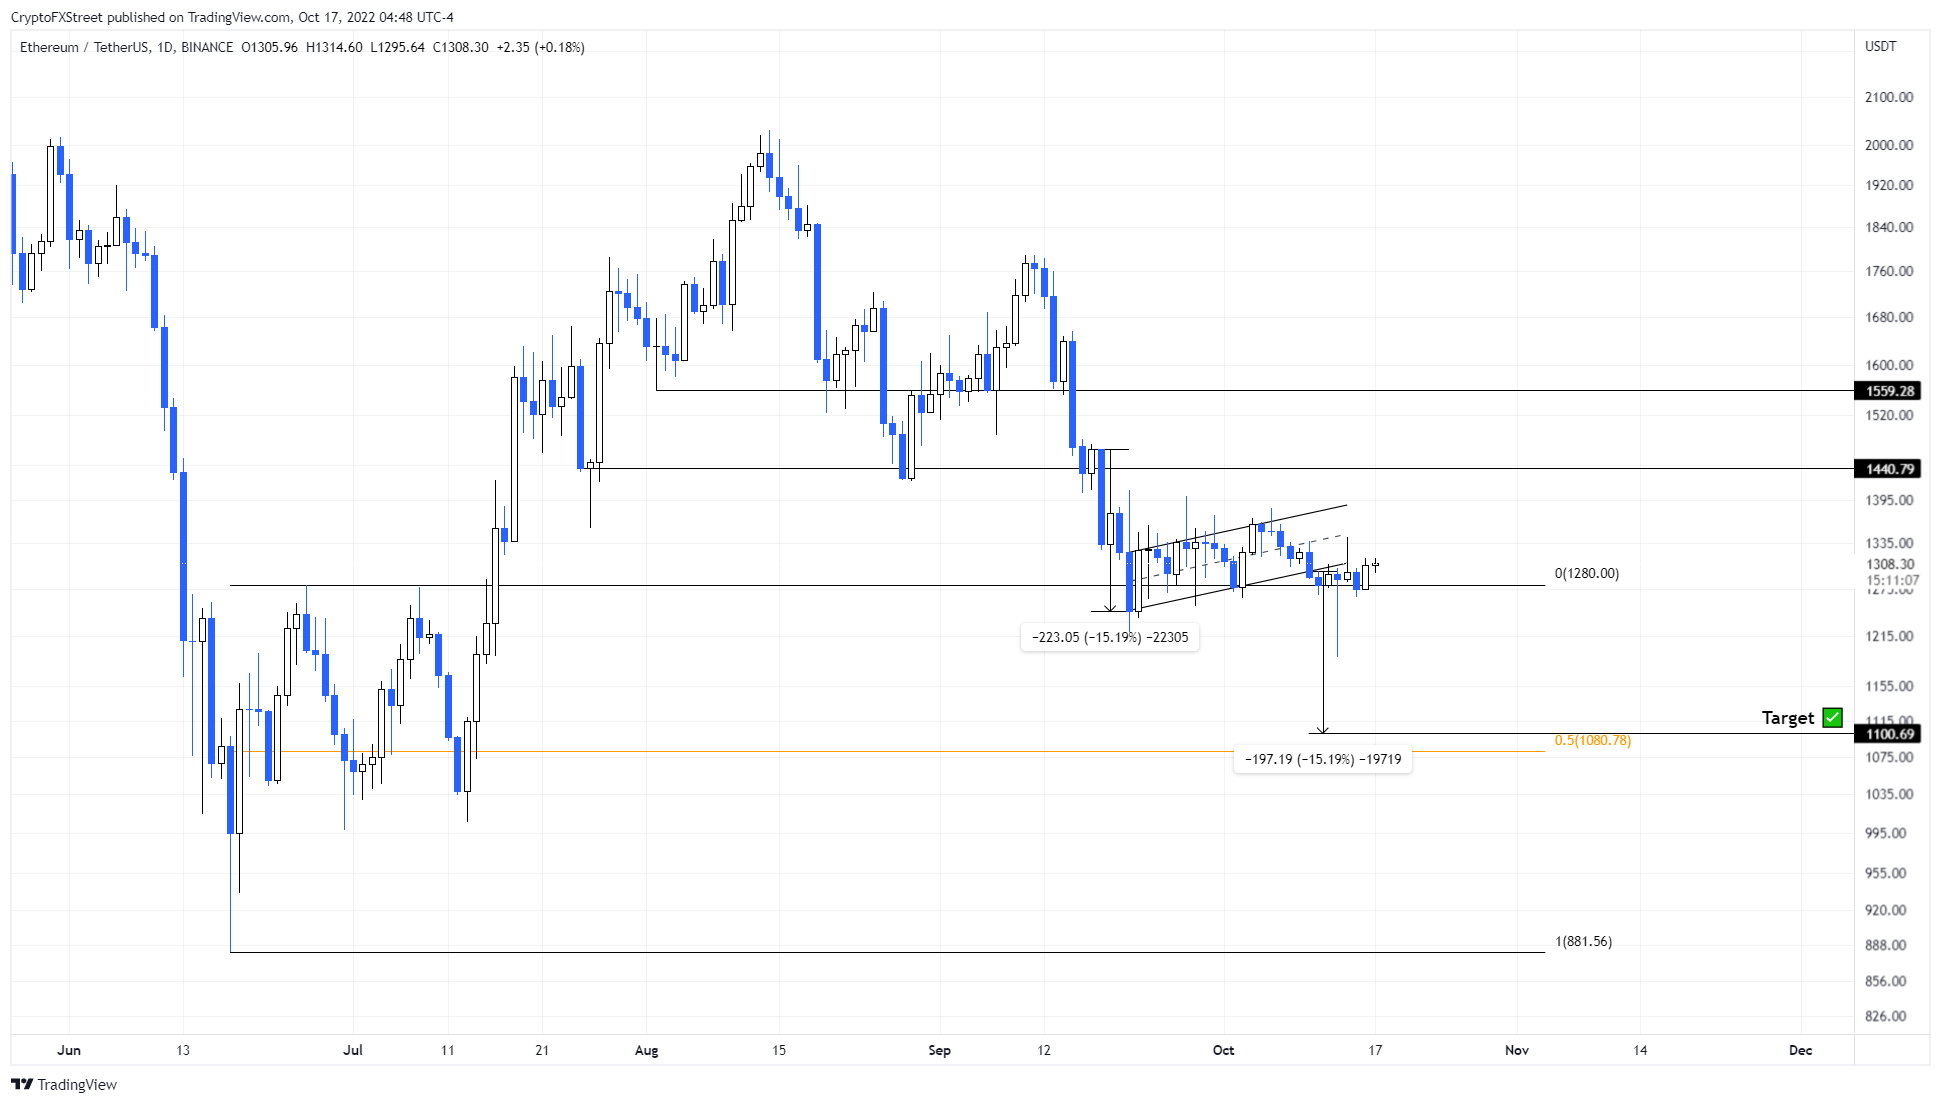
ETH/USD 1-day chart
While a bullish outlook for Ethereum price is likely, it is not possible if Bitcoin price continues to slide lower. A breakdown of the $1,280 support level will invalidate the bullish thesis for ETH and potentially trigger a sell-off to $1,200 and, in dire cases, $1,080.
Ripple price at an inflection point
Ripple price has produced two higher highs and two higher lows since September 23 and is currently retesting the upper limit of the $0.331 to $0.464 range for support. As long as the buyers defend this bullish market structure, a bounce seems likely.
The resulting move could produce a higher high and retest the $0.561 to $0.596 resistance area. This run-up would constitute a 20% upswing, however, investors must keep an eye on Bitcoin price to confirm the trend.
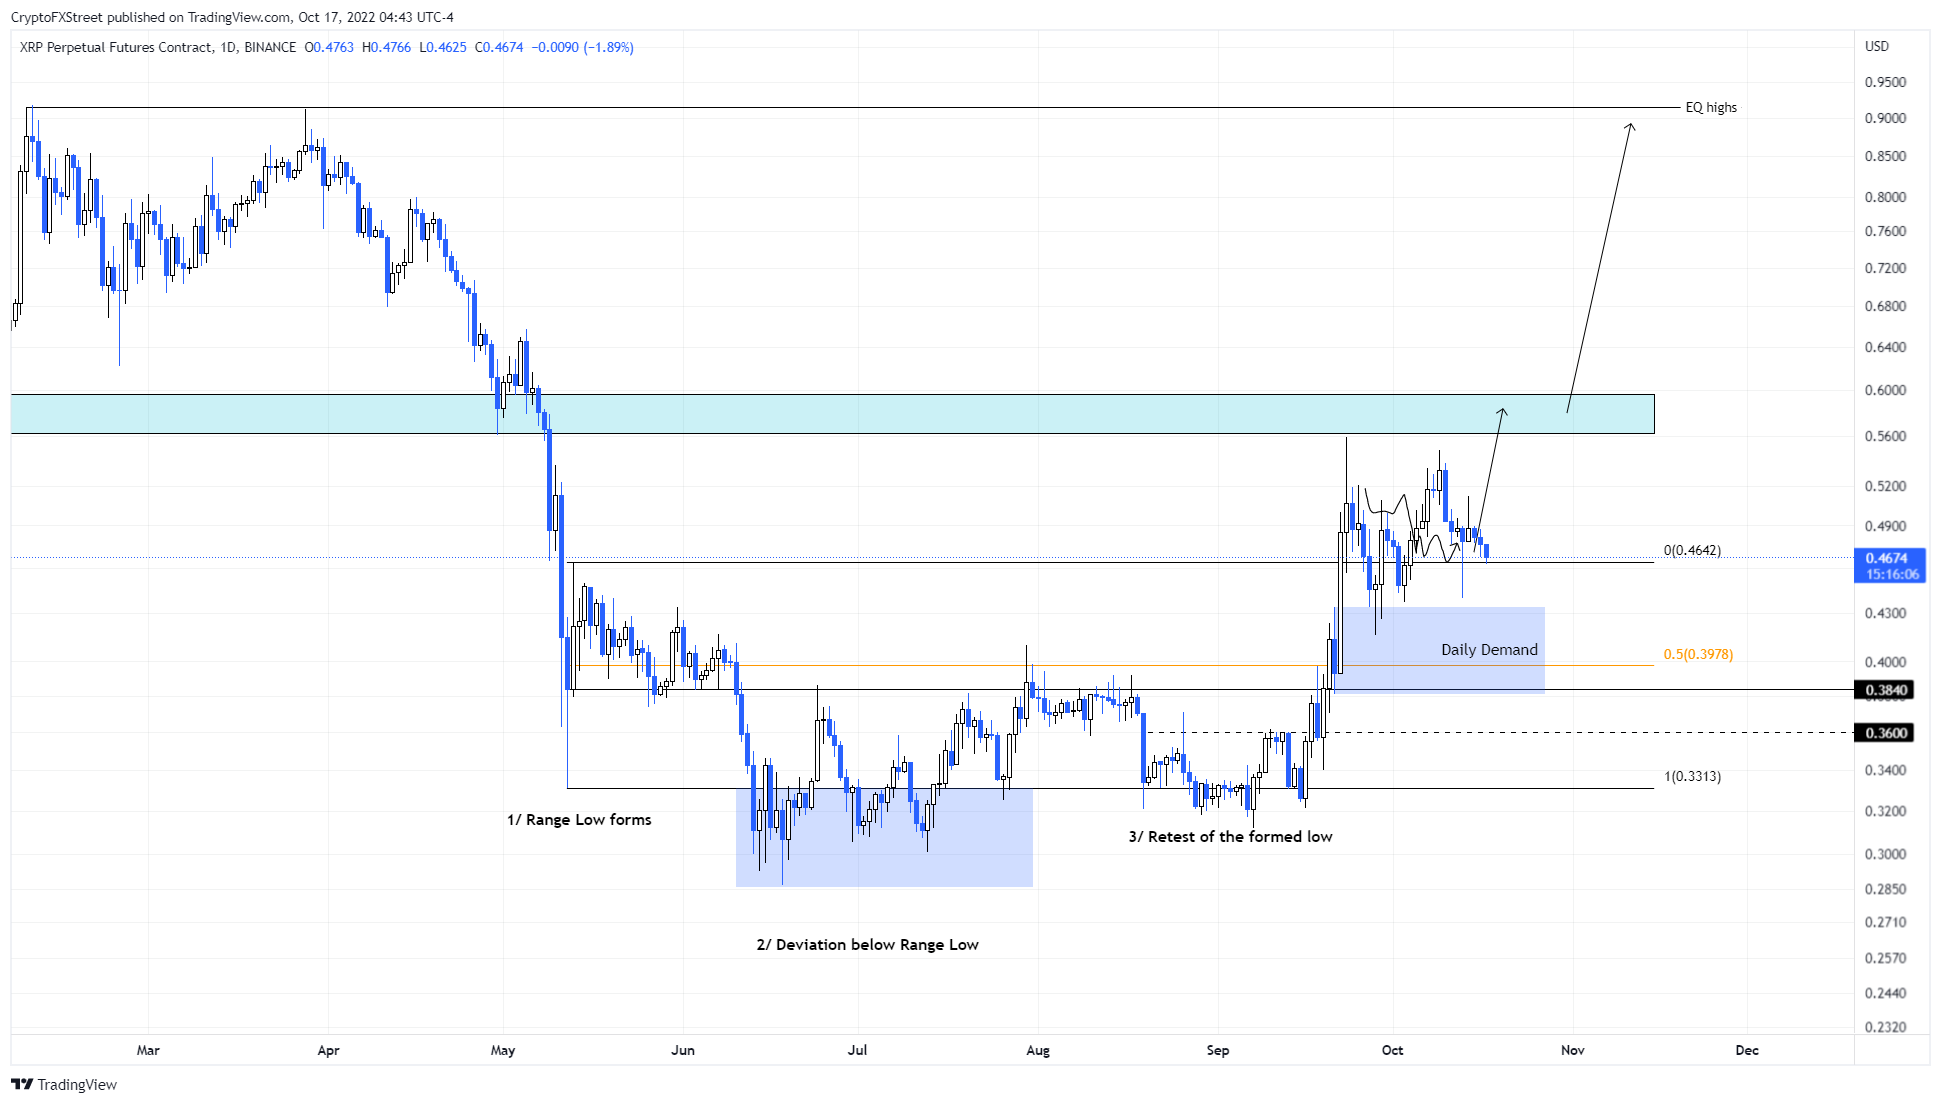
XRP/USD 1-day chart
While things are looking up for Ripple price, a spike in selling pressure that knocks XRP price below the October 3 swing low of $0.437 will invalidate the bullish market structure. However, investors can expect a slowdown of bearish momentum on a retest of the $0.381 to $0.433 demand zone.
