

BTC/USD Yet to Break Above $43,000 Level

Bitcoin Price Prediction – February 14
The Bitcoin price rebounds from the daily low of $41,570 as the buying interest may increase the bullish movement towards $45,000.
BTC/USD Long-term Trend: Bearish (Daily Chart)
Key levels:
Resistance Levels: $49,000, $51,000, $53,000
Support Levels: $38,000, $36,000, $34,000
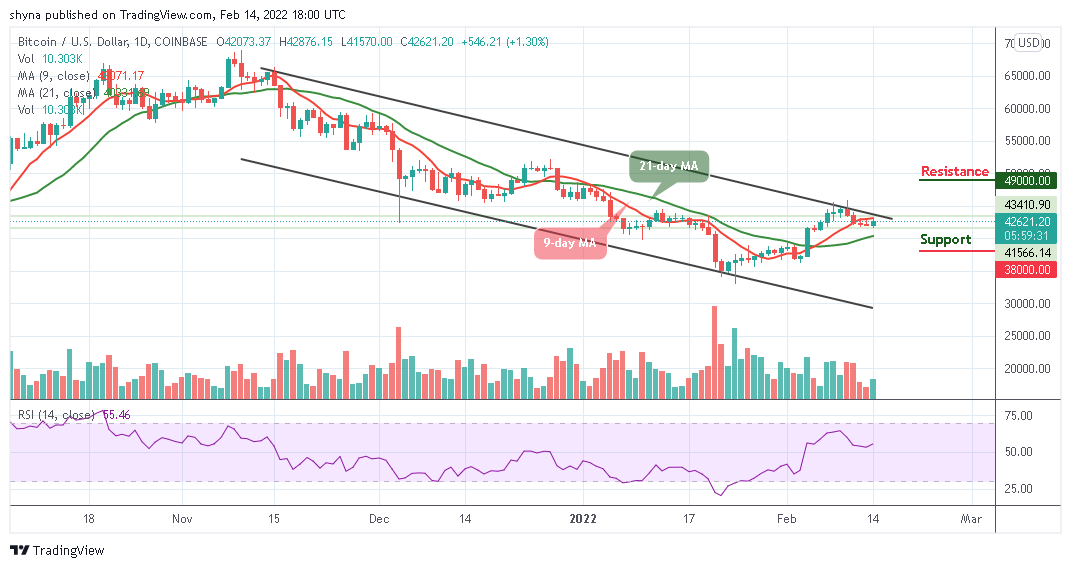
BTC/USD may continue to be range-bound in the market price stays within the 9-day and 21-day moving averages. However, as the market establishes a cross above the 9-day moving average, the buyers may begin to look for additional resistance levels above the upper boundary of the channel.
Bitcoin Price Prediction: BTC Price May Reclaim $45,000 Resistance
According to the daily chart, after the Bitcoin price begins the daily trade at $42,073, the king coin is now facing the resistance level of $43,000 and looking forward to crossing above the channel. However, the daily chart reveals that in as much as the 9-day moving average remains above the 21-day moving average, this confirms the next direction that the coin will follow. Moreover, BTC/USD may decline if the price breaks below the 21-day moving average. The Bitcoin price could rise if the $43,000 resistance is reached.
At the time of writing, the technical indicator Relative Strength Index (14) may likely cross above 55-level to indicate a bullish movement. Meanwhile, if the king coin crosses the above channel, it could reach the resistance levels of $49,000, $51,000, and $53,000 but any movement towards the lower boundary of the channel could hit the supports at $38,000, $36,000, and $34,000.

BTC/USD Medium-Term Trend: Ranging (4H Chart)
According to the 4-hour chart, the Bitcoin price is falling below the 9-day and 21-day moving averages as the technical indicator Relative Strength Index (14) moves below 50-level. However, if the Bitcoin price moves toward the upper boundary of the channel, the bullish influence could spike and the acquired more gains.
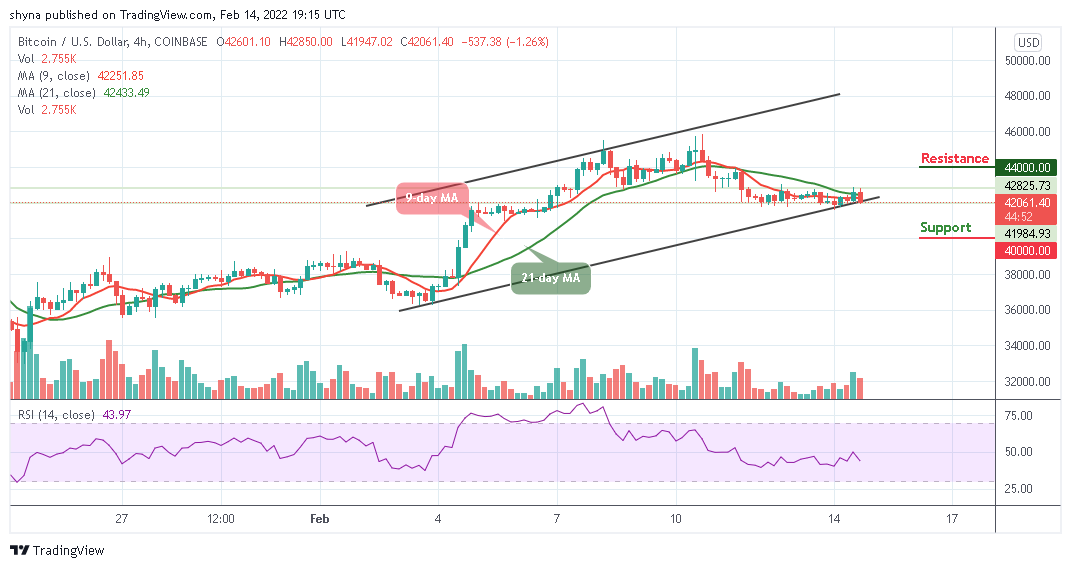
However, should in case the current candle failed to regain above the moving averages, the Bitcoin price may slide towards the support level of $40,000 and below. Furthermore, the bulls may need to keep the coin above the resistance level of $43,000 to break the potential resistance at $44,000 and above.
Looking to buy or trade Bitcoin (BTC) now? Invest at eToro!
68% of retail investor accounts lose money when trading CFDs with this provider
Read more:
