

BTC/USD May be Limited below $40,000 Level
Bitcoin Price Prediction – February 19
The Bitcoin price prediction could stop short of $39,500 as this level may be guarded by strong technical barriers.
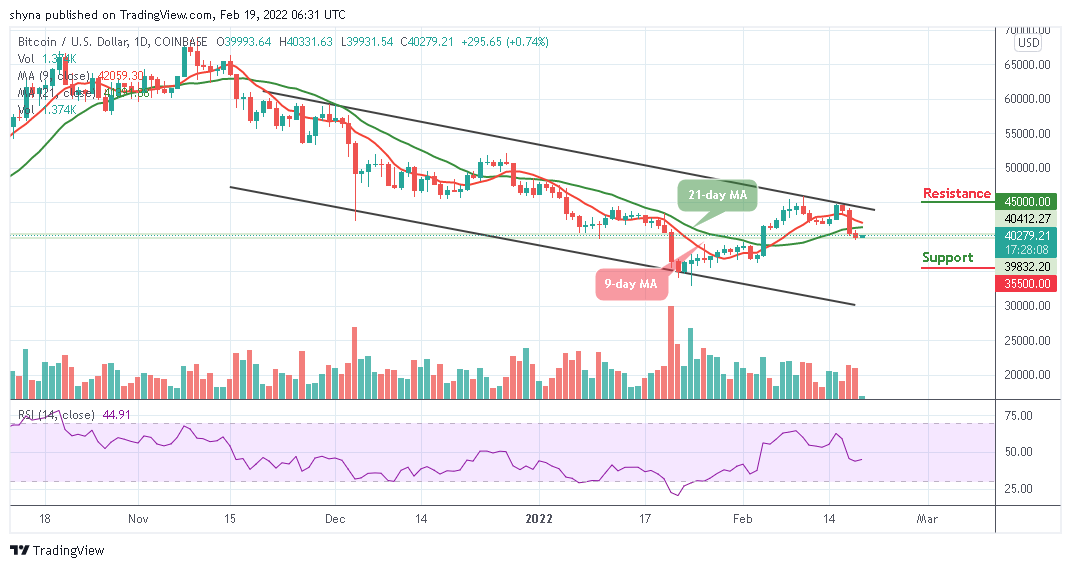
BTC/USD Long-term Trend: Bearish (Daily Chart)
Key levels:
Resistance Levels: $45,000, $47,000, $49,000
Support Levels: $35,500, $33,500, $31,500
BTC/USD surges and moves close to the resistance level of $40,333 but fails to break both the 9-day and 21-day moving averages. The first digital asset is currently gaining about 0.74% since the past few hours and could stay unchanged before the end of today’s trading. Meanwhile, BTC/USD is changing hands at $40,279.21. The coin remains in the hands of the bulls but needs to rise above $40,000 to escape the danger zone. Therefore, if the bulls could successfully push the price above the moving averages, the next resistance levels may be found at $45,000, $47,000, and $49,000.
Bitcoin Price Prediction: What Could Be the Next Direction for BTC?
At the time of writing, the Bitcoin price’s recent stability above $40,000 is likely to be a key ingredient to the surge that could occur in the next positive move. However, the bulls may be put on a test with BTC/USD moving back to the resistance level of $42,000 which happened to be the next focus for the coin.
On the downside, the critical support is created at a psychological $38,000. Meanwhile, the price could move towards the lower boundary of the channel and once this is done, the sell-off is likely to gain traction with the next focus on $37,000 and $36,000. However, any further low drive could send the price to the supports at $35,500, $33,500, and $31,500.

BTC/USD Medium – Term Trend: Ranging (4H Chart)
According to the 4-hour chart, the Bitcoin price is moving sideways below the 9-day and 21-days moving averages to reach where it currently trades at $39,998.64. However, the closest support level lies at $38, 000 and below, while crossing above the 9-day moving average could hit the nearest resistance level at $42,000 and above.
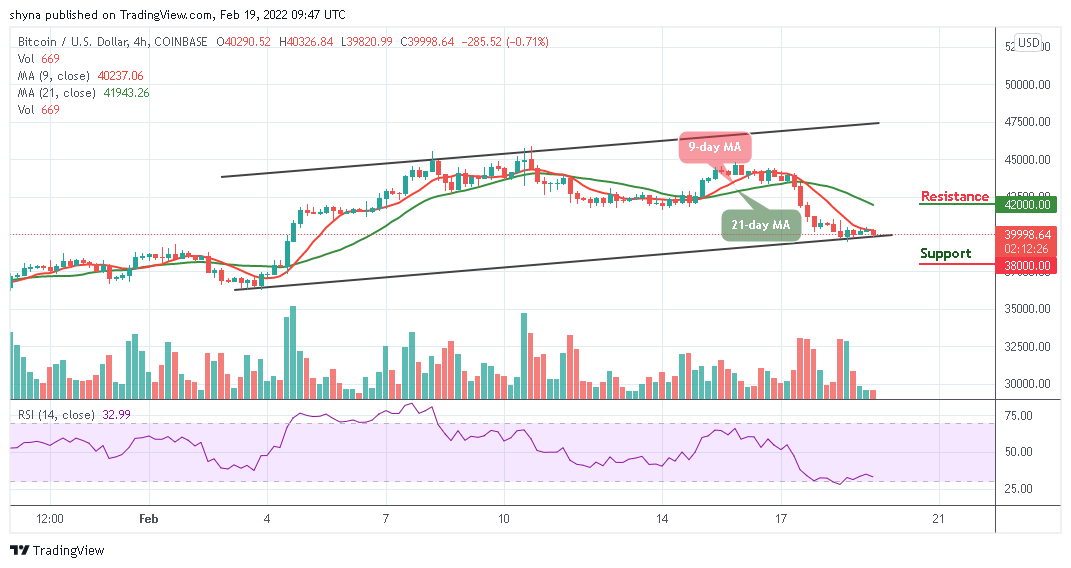
Moreover, as the coin slides to the downside, the technical indicator is likely to cross into the oversold region, flashing sell signals, which indicates a bearish movement.
Looking to buy or trade Bitcoin (BTC) now? Invest at eToro!
68% of retail investor accounts lose money when trading CFDs with this provider
Read more:


 Bitcoin
  Ethereum
  Tether
  BNB
BNB  Solana
  USDC
USDC  XRP
XRP  Dogecoin
  Toncoin