

BTC/USD Bears run out as Bulls Set Target at $52,000

Bitcoin Price Prediction – December 24
The Bitcoin price prediction keep on pushing towards the north as the king coin has not lost sight of $51,000 despite the rejection of $51,527.
BTC/USD Long-term Trend: Bearish (Daily Chart)
Key levels:
Resistance Levels: $55,000, $57,000, $59,000
Support Levels: $45,000, $43,000, $41,000
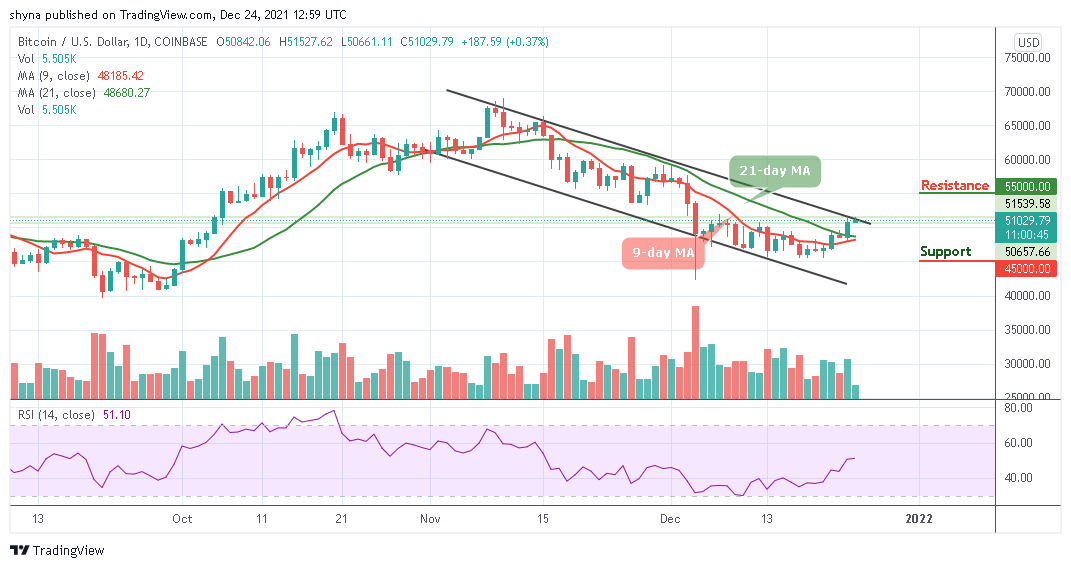
BTCUSD – Daily Chart
Since the past hours, BTC/USD continues to rip higher, adding to the 0.37% in gains at the moment. The coin is successfully trading above the 9-day and 21-day moving averages and above to cross above the upper boundary of the channel. As of the time of writing this article, the cryptocurrency trades for $51,029, the highest price since the week begins. Strongly bullish momentum is needed to nurture an uptrend targeting $52,000 in the short-term.
Bitcoin Price Prediction: Bitcoin (BTC) May be ready for the Upside
Looking at the daily chart, the Bitcoin price touches $51,527 at the time that the market opens today, if the bulls could successfully push the price above the upper boundary of the channel, the next resistance levels may be located at $55,000, $57,000, and $59,000. Typically when the new uptrends are beginning to surface, traders could use both the 9-day and 21-day moving averages as the nearest support level.
However, any failure by the bulls to move the price up, we may see a price cut below the moving averages and a further low drive could send the price to the support levels of $45,000, $43,000, and $41,000. For now, the bulls are dominating the market. But as things stand, the BTC/USD price may continue to follow the upward trend because the technical indicator Relative Strength Index (14) also focuses on the north as the signal line moves above 50-level.

BTC/USD Medium-Term Trend: Ranging (4H Chart)
The Bitcoin price is surging upwards, catapulting its price to reach where it is currently trading at $51,128 after touching $51,198 a few hours ago. However, the closest resistance levels lie at $53,000 and $54,000, while the nearest supports are $49,500 and $48,500 respectively.
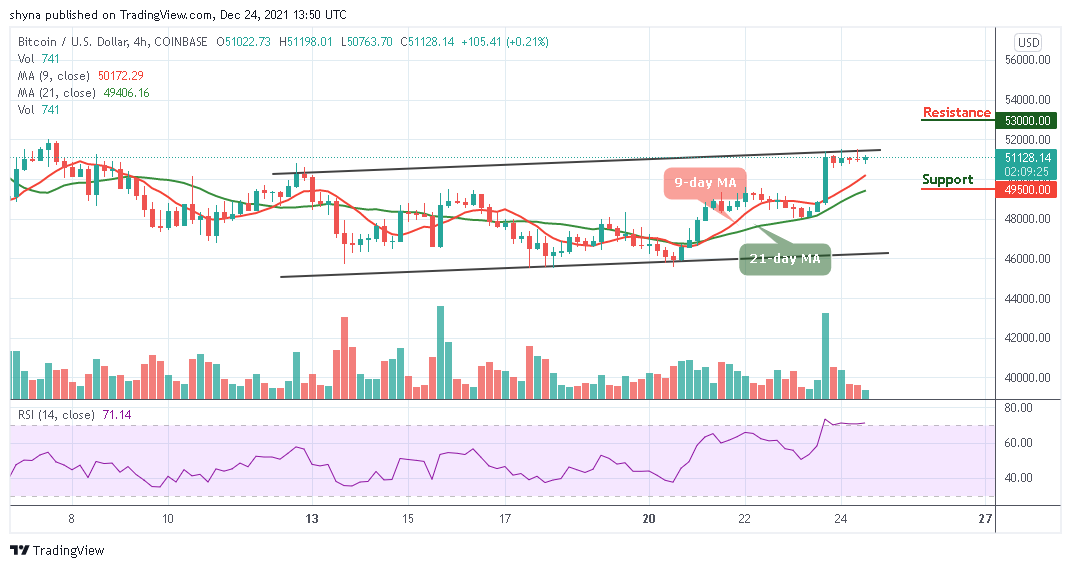
BTCUSD – 4 Hour Chart
Moreover, as the coin ranges above the 9-day and 21 -day moving averages, the technical indicator is strongly bullish and still flashing buy signals. The Relative Strength Index (14) is surging along with the price as the signal line remains within the overbought region.
Looking to buy or trade Bitcoin (BTC) now? Invest at eToro!
68% of retail investor accounts lose money when trading CFDs with this provider
Read more:
