

BTC Retreats After Moving Close to $30,000 Level

The Bitcoin price prediction increased considerably but despite the rejection, the bullish structure still stays around the $30,000 level.
BTC/USD Long-term Trend: Ranging (Daily Chart)
Key levels:
Resistance Levels: $36,000, $38,000, $40,000
Support Levels: $24,000, $22,000, $20,000
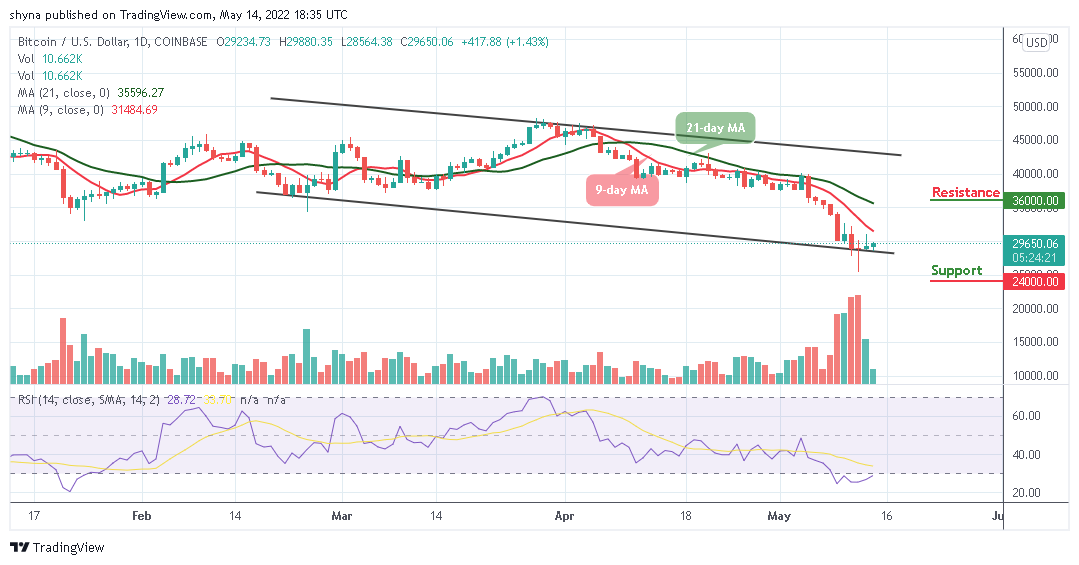
Looking at the daily chart, the Bitcoin bears may be actively taking back control as they are likely to force BTC/USD to bow down to fresh losses. The first digital asset may correct below the previous support at $28,564. At the time of writing, BTC/USD is changing hands at $29,650 after adjusting lower from $29,880 which is an intraday high. In addition, Bitcoin may be vulnerable to losses if the 9-day moving average remains below the 21-day moving average.
Bitcoin Price Prediction: Bitcoin (BTC) May Remain at the Downside
Looking at the Bitcoin price, one can say that the market price may likely follow the downtrend. For example, the technical indicator Relative Strength Index (14) may confirm the bearish movement as it is likely to remain within the oversold region. However, BTC/USD is still at great risk of dropping below the lower boundary of the channel.
Moreover, bulls are banking on the support level of $29,000 to ensure that despite a rejection, the Bitcoin price stays above the $30,000 level. Any further bearish movement below this could push the coin towards the critical supports of $24,000, $22,000, and $20,000. Meanwhile, following the upward movement, if the coin moves above the 9-day and 21-day moving averages, it may hit the nearest resistance levels at $36,000, $38,000, and $40,000 respectively.

BTC/USD Medium-Term Trend: Bearish (4H Chart)
BTC/USD is seen hovering below the 9-day and 21-day moving averages as the 4-hour chart reveals, the bears may continue to be in control while the bulls are trying to defend the $29,500 support. If not, the $26,000, $24,000, and $22,000 support levels may come into play if the coin focuses on the downward movement.
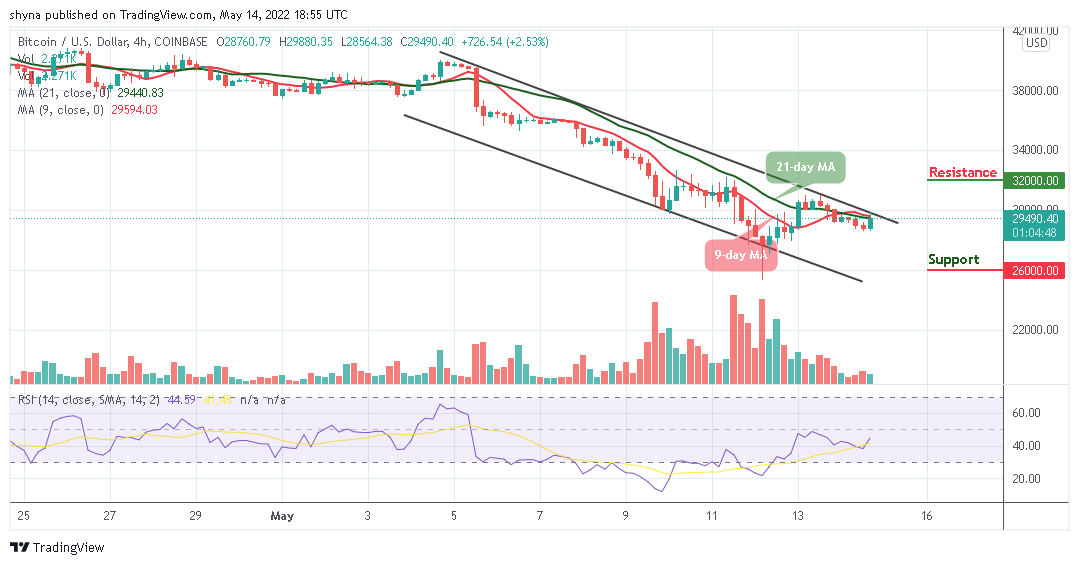
Moreover, buyers may need to regroup and hold the support of $29,000, once this is done, traders may expect a cross above the upper boundary of the channel, and breaking this barrier may further push the king coin to the resistance levels of $32,000, $34,000, and $36,000. Meanwhile, the technical indicator Relative Strength Index (14) is seen below 50-level, suggesting a sideways movement.
Looking to buy or trade Bitcoin (BTC) now? Invest at eToro!
68% of retail investor accounts lose money when trading CFDs with this provider
Read more:
