

Bitcoin Price Prediction: BTC/USD Plummets Under $45,000

Bitcoin Price Prediction – February 8
The Bitcoin price prediction shows that BTC is currently facing the down but consolidation is likely to play out between $40,000 and $45,000.
BTC/USD Long-term Trend: Bearish (Daily Chart)
Key levels:
Resistance Levels: $50,000, $52,000, $54,000
Support Levels: $39,000, $37,000, $35,000
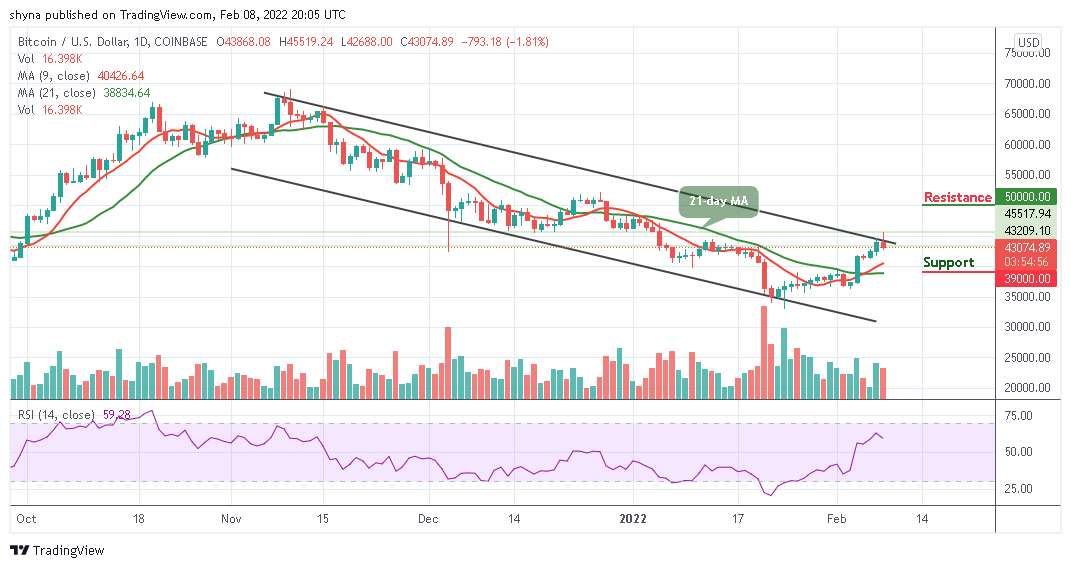
Today, BTC/USD retreats below the resistance level of $45,519. The number-one crypto is now moving below the upper boundary of the channel as the price heads toward the 9-day and 21-day moving averages. However, the Bitcoin price did not stay up for long because of an immediate reversal. Therefore, the daily chart reveals that the market may experience a slight bearish movement.
Bitcoin Price Prediction: Would BTC Rebound Above the Channel?
At the time of writing, the Bitcoin price is hovering at $43,074 with a loss of 1.18% on the day. The trading is likely to face a downtrend as the technical indicator Relative Strength Index (14) moves to cross below 60-level. It is important that the bulls must reclaim the position above $45,000 as this would allow them to focus on higher levels towards $48,000. On the other side, continued declines under the short-term support at $42,000 could easily open the way to the south.
Meanwhile, the breakdown towards $40,000 is not out of the picture because the losses in the last 24 hours show that BTC/USD may not be technically ready for the breakout above $60,000 but the king coin can still make an attempt to regain ground and any bullish movement to the upside may push the coin to the resistance level of $50,000, $52,000, and $54,000 while the supports lie at $39,000, $37,000, and $35,000 respectively.

BTC/USD Medium – Term Trend: Bearish (4H Chart)
According to the 4-hour chart, the Bitcoin price is now hovering within the 9-day and 21-day moving averages. However, if the price drops and move below the 21-day MA, it could reach the nearest support levels at $41,500 and below.
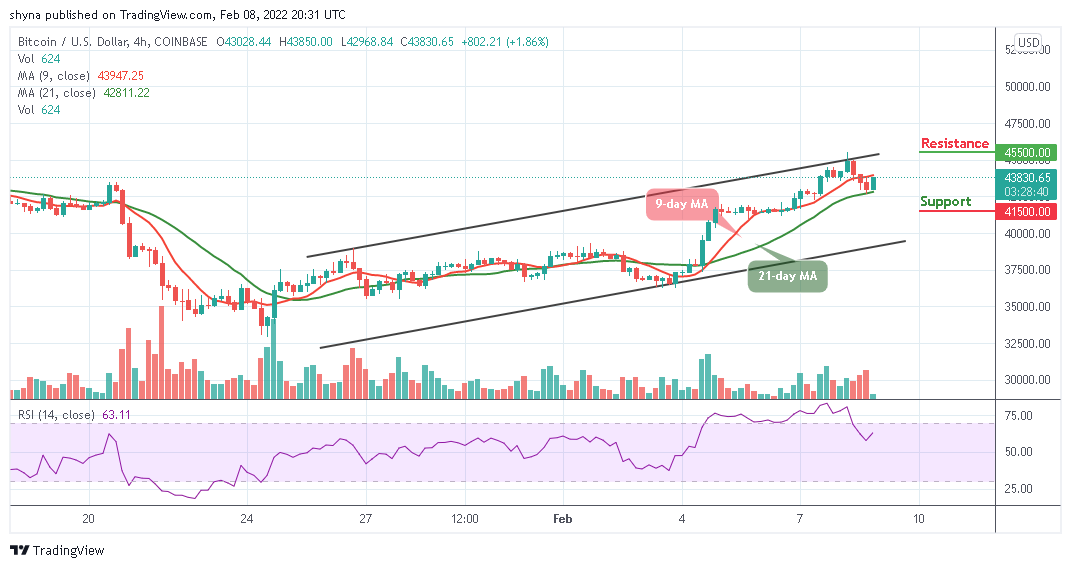
Moreover, if the bulls push the coin above the upper boundary of the channel, the Bitcoin price may likely reach the potential resistance level of $45,500 and above. Now, the market is likely to rebound as the technical indicator Relative Strength Index (14) stays above 60-level.
Looking to buy or trade Bitcoin (BTC) now? Invest at eToro!
68% of retail investor accounts lose money when trading CFDs with this provider
Read more:
