

Bitcoin Price Prediction: BTC/USD Maintains $38,000 Level

Bitcoin Price Prediction – January 30
According to the daily chart, the Bitcoin price prediction touches the daily low at $37,744 as losses under $38,000 beckon.
BTC/USD Long-term Trend: Bearish (Daily Chart)
Key levels:
Resistance Levels: $44,000, $46,000, $48,000
Support Levels: $33,000, $31,000, $29,000
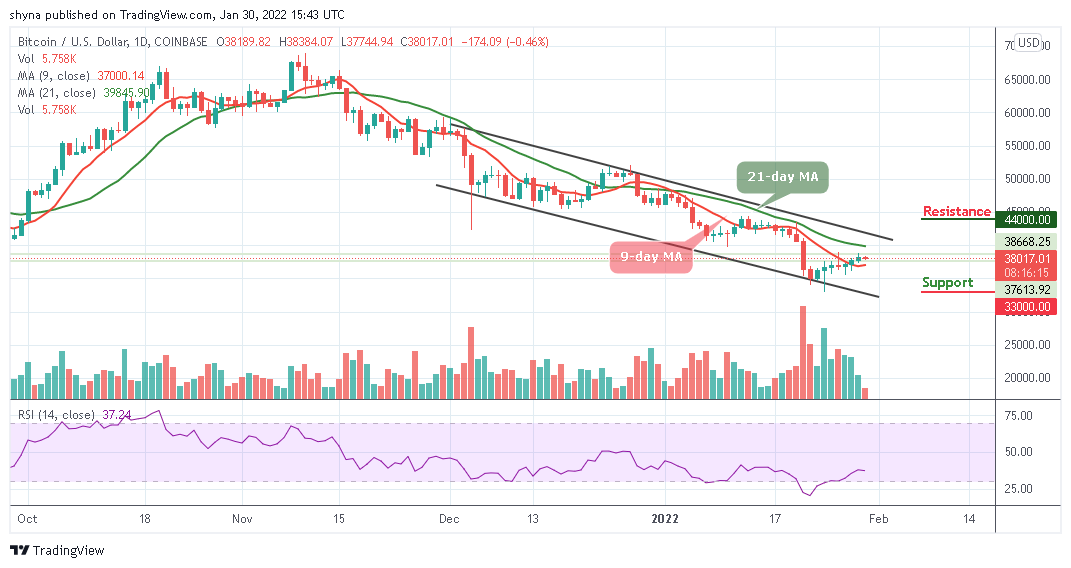
BTC/USD is seentrading within the 9-day and 21-day moving averages. The Bitcoin price is likely to break many important supports near $36,500 and $36,000 and it seems like bears are gaining strength and they might aim for a test of 35,000 support again. However, any more losses could spark a larger decline towards the lower boundary of the channel and the bears could hold BTC/USD below the 9-day moving average.
Bitcoin Price Prediction: Can Bitcoin (BTC) Stay Above $38,000?
According to the daily chart, the Bitcoin price seems to have accepted that recovery is not possible at this moment. Despite holding the current market price above $37,000, this support has been overwhelmed amid the ongoing mid-week trading session. Thus, Bitcoin price is teetering around $38,017 while bears tighten their grip. In other words, the Bitcoin price is expected to rise above the 21-day moving average before heading towards the potential resistance levels at $44,000, $46,000, and $48,000.
Meanwhile, the Bitcoin price has been moving downwards since a month ago after it reached a local high of $68,000. However, the ongoing descent has caused daily time-frame indicators to turn bearish as the Relative Strength Index (14) remains below 40-level. Therefore, the daily signals are bearish, and a further low drive could send the price to $33,000, $31,000, and $29,000 supports.

BTC/USD Medium – Term Trend: Ranging (4H Chart)
The 4-hour chart reveals that BTC/USD bulls are likely to step back into the market, trading above the 9-day and 21-day moving averages. Meanwhile, the $41,000 and above may be visited if the Bitcoin price crosses above the upper boundary of the channel.
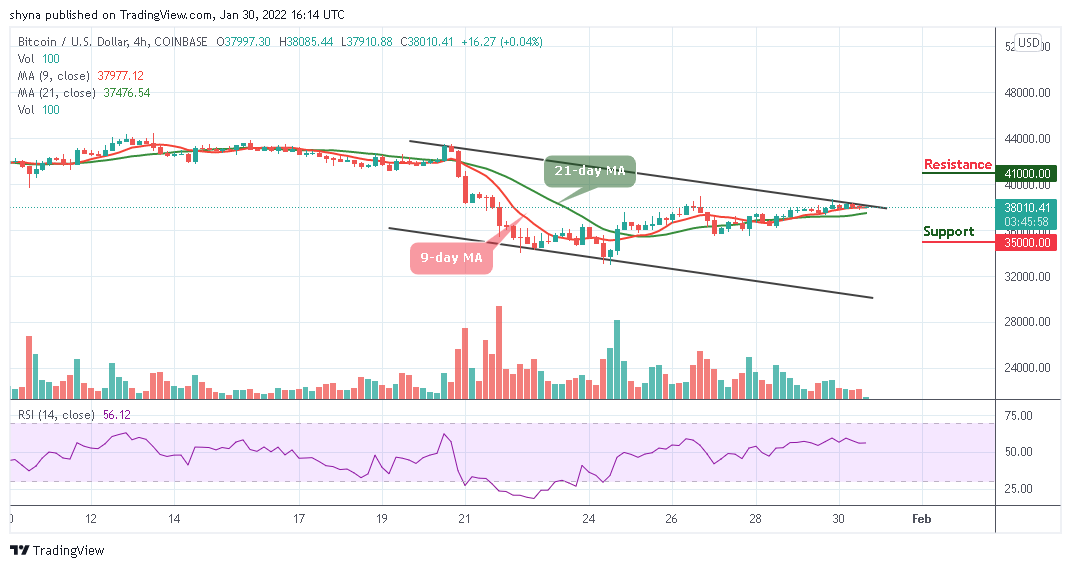
On the contrary, if the sellers hit the market again and bring the price to the south, traders may expect a break below the moving averages. Breaking this barrier may further allow the bears to touch the support level of $35,000 and below but the technical indicator Relative Strength Index (14) is moving below 60-level, indicating a sideways movement.
Looking to buy or trade Bitcoin (BTC) now? Invest at eToro!
68% of retail investor accounts lose money when trading CFDs with this provider
Read more:
