

BCH/USD Rebounds as Price Faces $300 Level

Bitcoin Cash Price Prediction – January 29
The Bitcoin Cash price prediction shows that BCH is moving sideways with the short-term outlook getting ready for the upward movement.
BCH/USD Market
Key Levels:
Resistance levels: $400, $420, $440
Support levels: $200, $180, $160
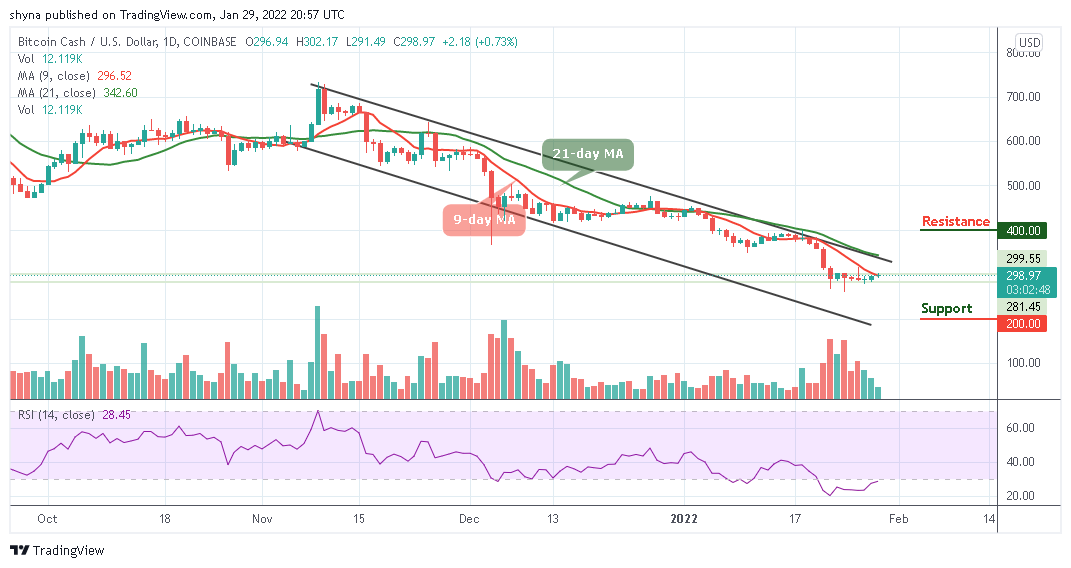
According to the daily chart, BCH/USD is trying to resume back into the positive side at the time of writing. However, due to lack of enough buying power, bulls could not sustain higher growth above the 9-day moving average. Meanwhile, the technical indicator Relative Strength Index (14) is moving away from the oversold region as the signal keeps pointing to the north. Looking back at the recent dip, recovery has been steady slowly but acutely limited under $300.
Bitcoin Cash Price Prediction: Bitcoin Cash (BCH) May Resume Uptrend
The Bitcoin Cash price is trading at $298.97 as the immediate downside is protected by the support level of $290. Besides, the range at $300 is a key to the BCH trading while moving towards the lower boundary of the channel could lead to the support levels of $200, $180, and $160. Looking at the daily chart, sideways trading action could dominate the current session, and this may continue in the coming sessions.
However, following the recent price, BCH/USD is currently facing a potential resistance above the 9-day moving average but a break above this barrier is likely to produce a huge green candle to the upside, which could reach the resistance levels at $400, $420, $440.

Against BTC, the market keeps moving below the 9-day and 21-day moving averages. At the time of writing, the Bitcoin Cash price is seen hovering at 781 SAT. If the Bitcoin cash crosses above the 9-day and 21-day moving averages, it may likely meet resistance at 870 SAT and above.
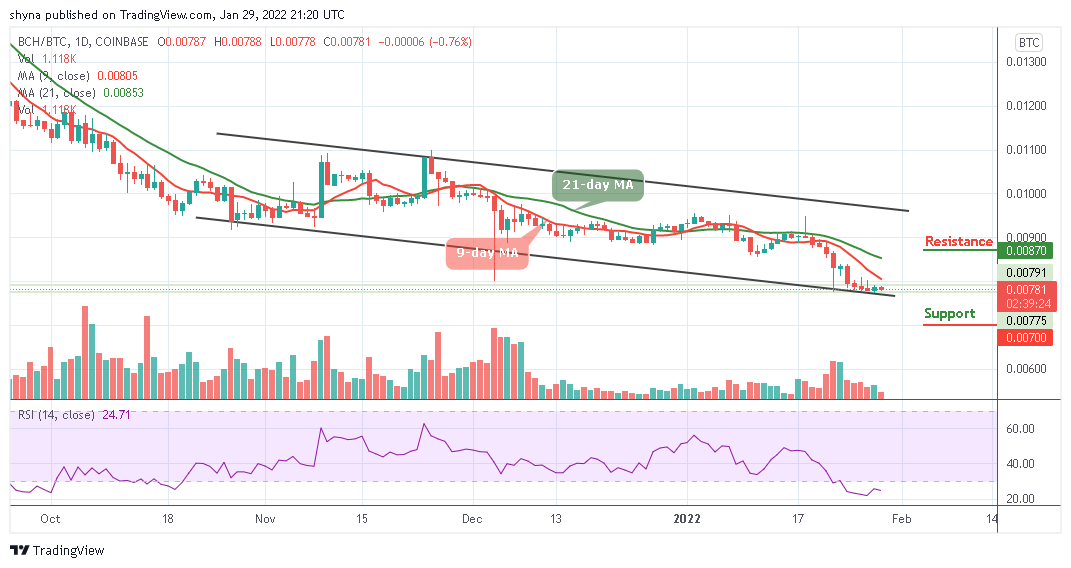
Meanwhile, looking at the daily chart, we can say that the market price is likely to follow the downward movement as the technical indicator Relative Strength Index (14) moves within the overbought region while the signal line is seen pointing down. More so, should Bitcoin Cash drops below the lower boundary of the channel, it may find support at 700 SAT and below.
Looking to buy or trade Bitcoin Cash (BCH) now? Invest at eToro!
68% of retail investor accounts lose money when trading CFDs with this provider
Read more:
