

Avalanche Approaches Vital Support Level, What Comes Next?

Avalanche (AVAX) has experienced a bearish trend over the past few months, particularly after being rejected from the $17.50 price level. This rejection has allowed the bears to exert significant control over the price. In the last 24 hours, AVAX made a slight upward movement of 0.5%. On the weekly chart, it has lost approximately 3.5% of its value.
With the technical outlook on the daily timeframe, the bears have an advantage. Both demand and accumulation indicators remain low on the chart, indicating a decrease in buying strength.
It is worth noting that the recent volatility displayed by Bitcoin has influenced the price patterns of many altcoins, including AVAX. In order for altcoins like AVAX to surpass their immediate resistance levels, Bitcoin needs to stay above the $26,000 price mark.
Presently, AVAX is trading close to a critical support level. If sellers exert more pressure, the altcoin may experience a significant decline in value. The decrease in market capitalization for AVAX indicates a lower buying strength in the market.
Avalanche Price Analysis: One-Day Chart
As of the time of writing, AVAX was trading at $13.90. The coin faces an overhead resistance at $14, and if it manages to surpass this level, it is likely to encounter strong resistance at $14.20.
On the downside, if the price falls from its current level, it may break below the support mark at $13.80. This may lead the altcoin to trade near the $13.50 price level. The trading volume of AVAX in the last session was low, indicating that sellers still have an advantage in the market.
Technical Analysis
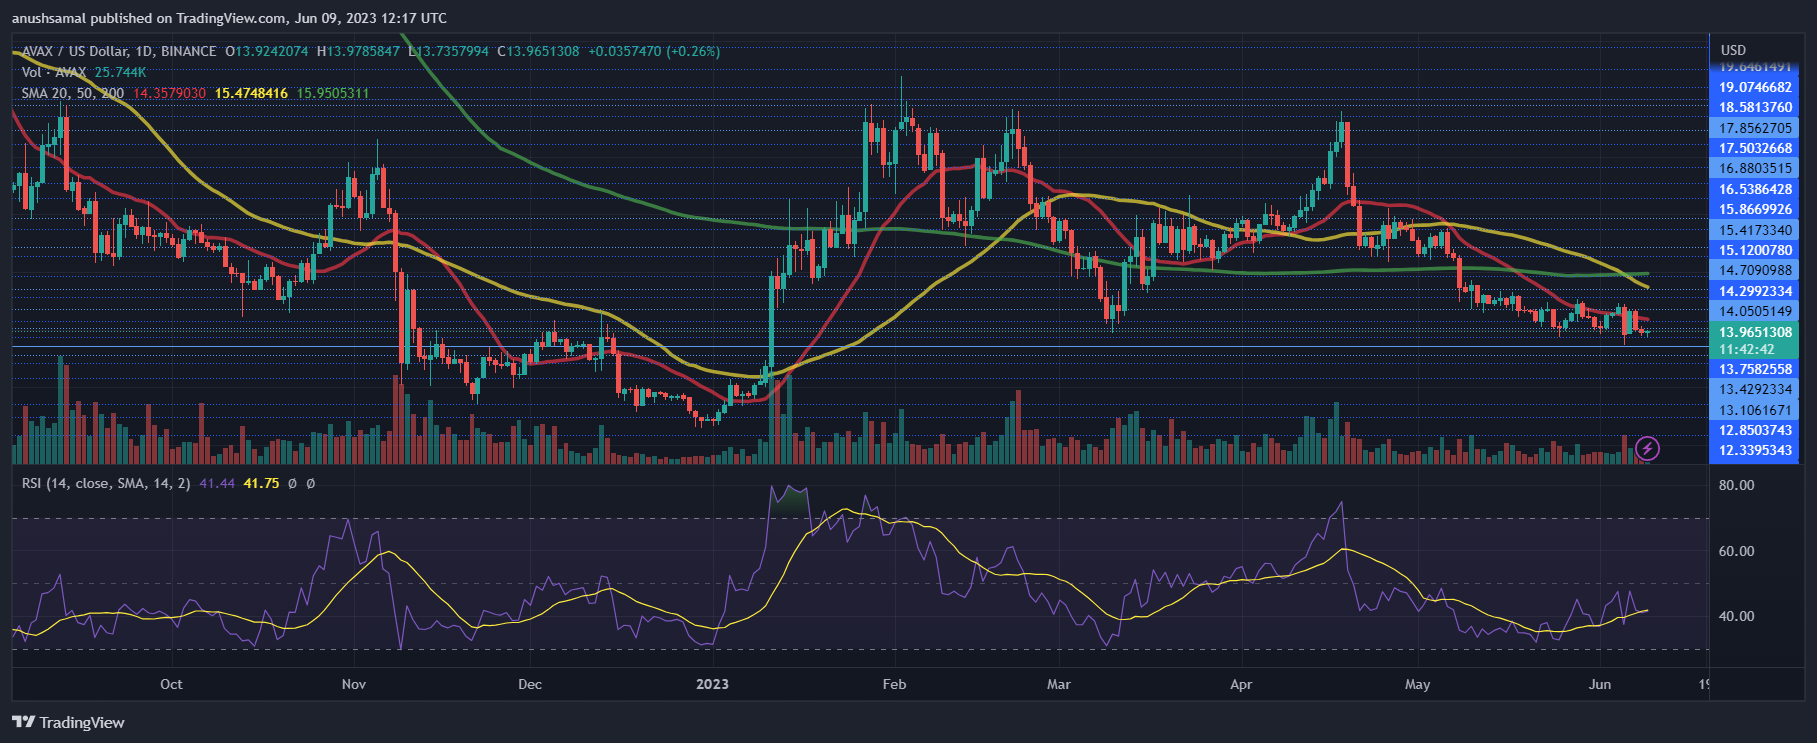
During the months of May and towards the end of April, AVAX experienced low buying strength. The Relative Strength Index (RSI) indicated that sellers had control over the price, as the RSI remained below the half-line and showed a downward trend at the time of writing.
Additionally, the price moved below the 20-Simple Moving Average (SMA), suggesting low demand and indicating that sellers were driving the price momentum in the market. If the price of AVAX attempts to rise above the $14 mark, it is expected that demand will return to the market.
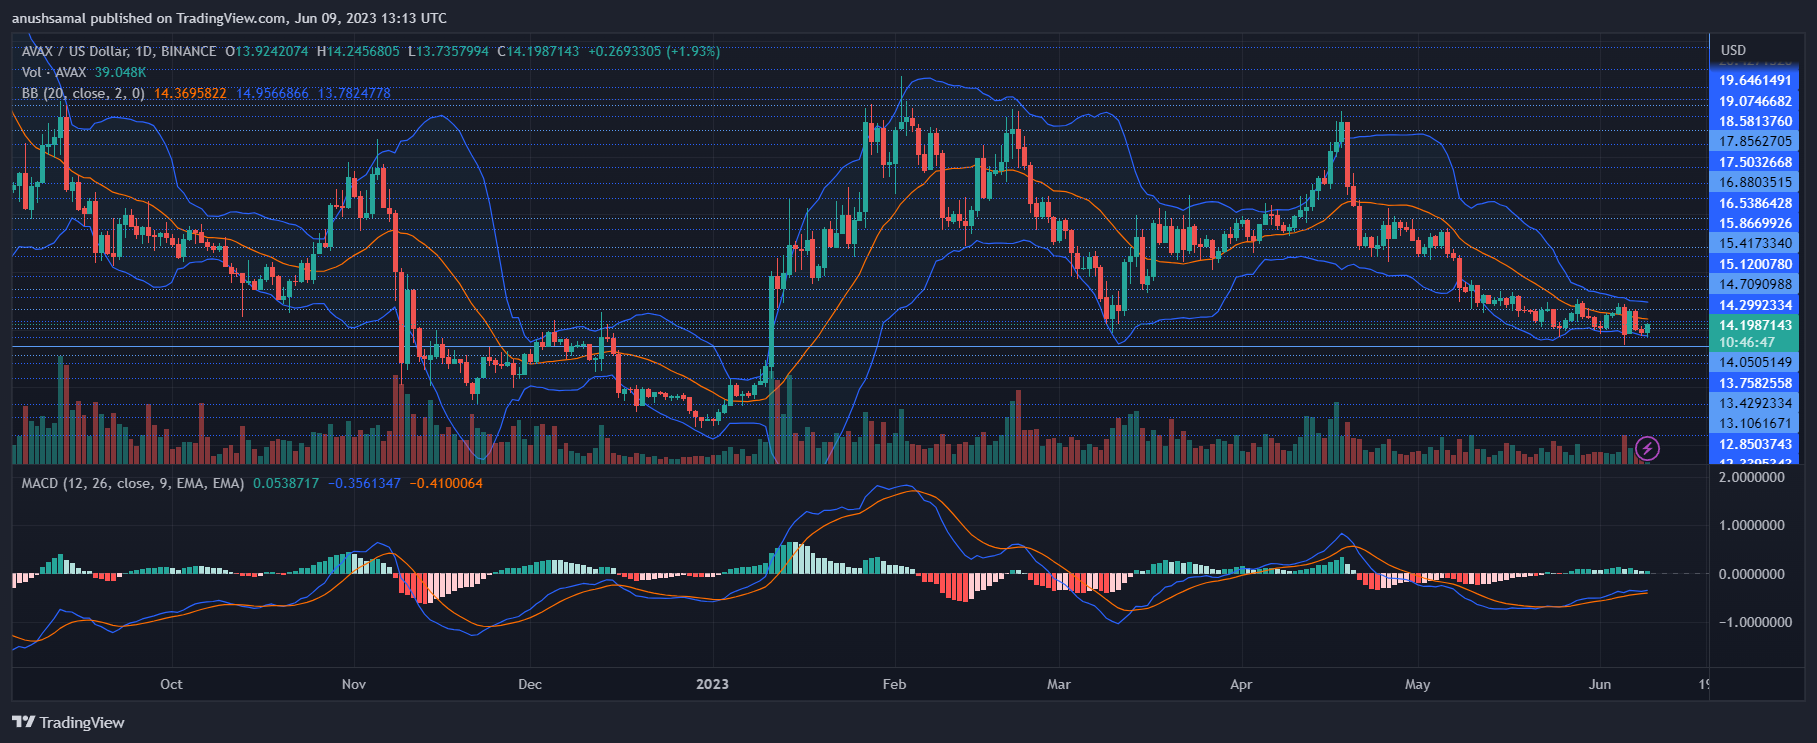
In line with other technical indicators, AVAX has shown reduced buying signals, indicating a downtrend. The Moving Average Convergence Divergence (MACD) is a momentum indicator that helps identify price reversals. In the case of AVAX, it displayed declining green histograms, suggesting diminishing buy signals.
The Bollinger Bands, which measure price volatility and fluctuations, tightened at the time of writing. This tightening indicates that there is a possibility of increased volatility in the price of AVAX in the upcoming trading sessions. When the Bollinger Bands tighten, it often indicates a potential breakout in the near future.
Featured Image From UnSplash, Charts From TradingView.com
