

A trend-defining decision comes soon
- Bitcoin price continues to consolidate within a bearish pennant pattern.
- Ethereum price could retest the recently established lows.
- XRP price may witness an exit liquidity pump if the market stays stagnant.
The crypto market is losing ground as far as a bullish counterstrike is concerned. The bear rally witnessed earlier in the month has formed a bearish pennant-looking formation on Bitcoin and Ethereum, which could spell bad news for the rest of the market. The resolve on the bearish congestion zone will likely occur soon.
Bitcoin price remains confined
Bitcoin price has yet to show its cards as an ongoing consolidation is below $17,000. Following the 25% decline earlier in the month, the peer-to-peer digital currency has been confined to a coiling trading range. A pennant formation is displayed near the newly established monthly lows, which would result in a crash of equal value to the prior rally.
Bitcoin price currently trades at $16,682 as the bears have forged several rejections at the $17,000 through the 8-day exponential moving average. Using classical analysis, a projection can be made from the pennant-looking pattern formed this week. If the technicals are correct, the bearish targets lie at $14,000 and potentially $12,750.
Invalidation of the bearish idea is a breach above the $18,250 thrust candle. If the level is tagged, the bulls could produce a countertrend spike back to $20,000. The Bitcoin price would rise by 23% if the invalidation scenario occurs.
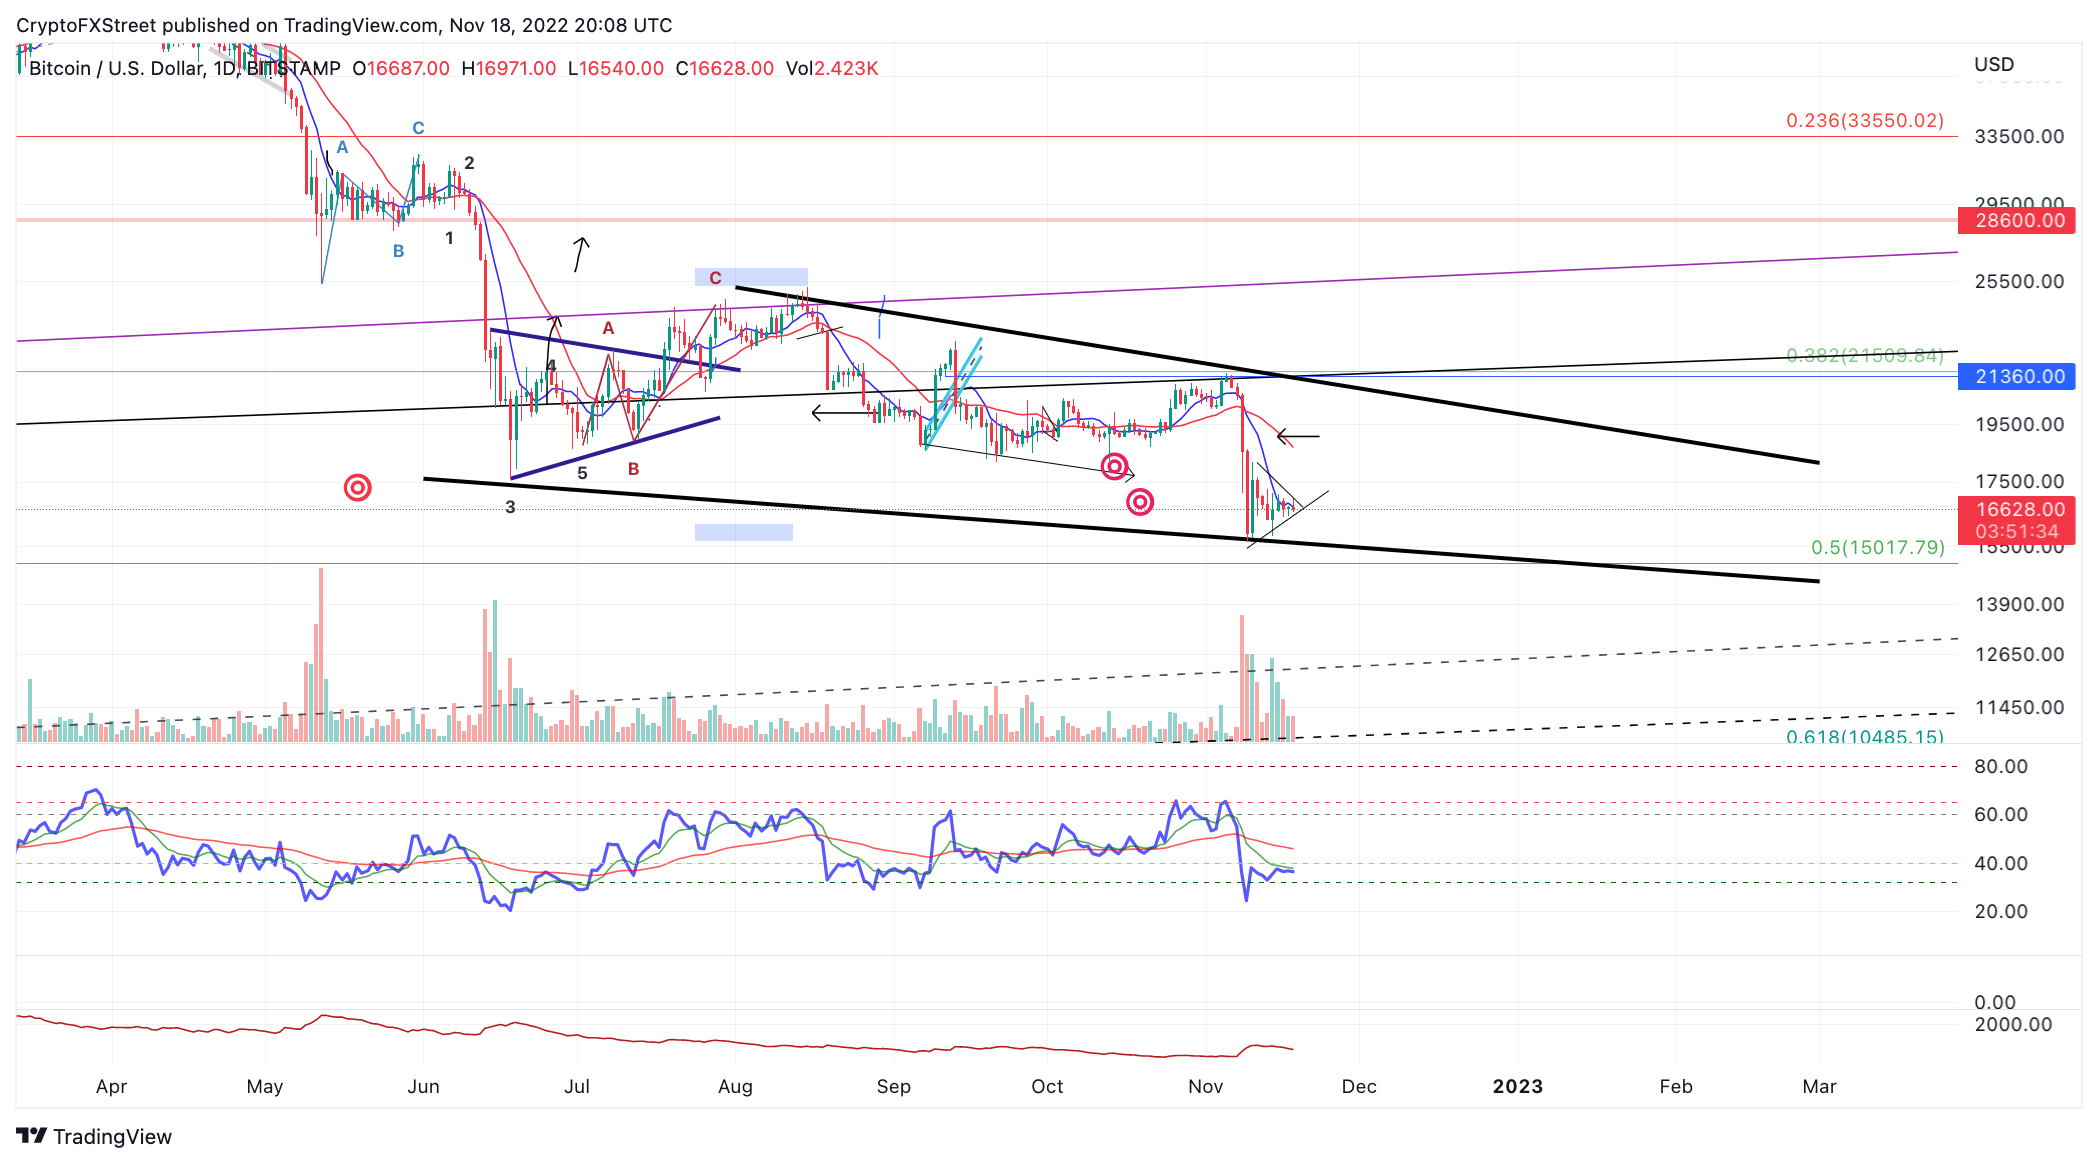
BTCUSDT 1-day chart
In the following video, our analysts deep dive into the price action of Bitcoin, analyzing key levels of interest in the market. -FXStreet Team
Ethereum price is still underwater
Ethereum price continues to display a bearish stronghold as the third trading week of November goes into the weekend. After a 35% decline witnessed earlier this month, the bullish attempts to recover have all been rejected. If market conditions persist, the bears could induce a downswing toward the recently established lows at $1,080
Ethereum price currently auctions at $1,205. Like Bitcoin, ETH has yet to be able to hurdle the 8-day exponential moving average. The Volume Profile Indicators’ sparse reading could suggest that high-cap investors will remain sidelined until a definitive trend as a result of the congestion is established.
If the market is genuinely bearish, ETH’s next target will be $1,080 and potentially the summer lows at $880.
Invalidation of the bearish could arise if the bulls reconquer the $1,350 swing high. In doing so, an additional spike toward the 21-day simple moving average at $1,450 could occur. The Ethereum price would rise by a 20% increase from the current market value if the invalidation scenario were to occur.
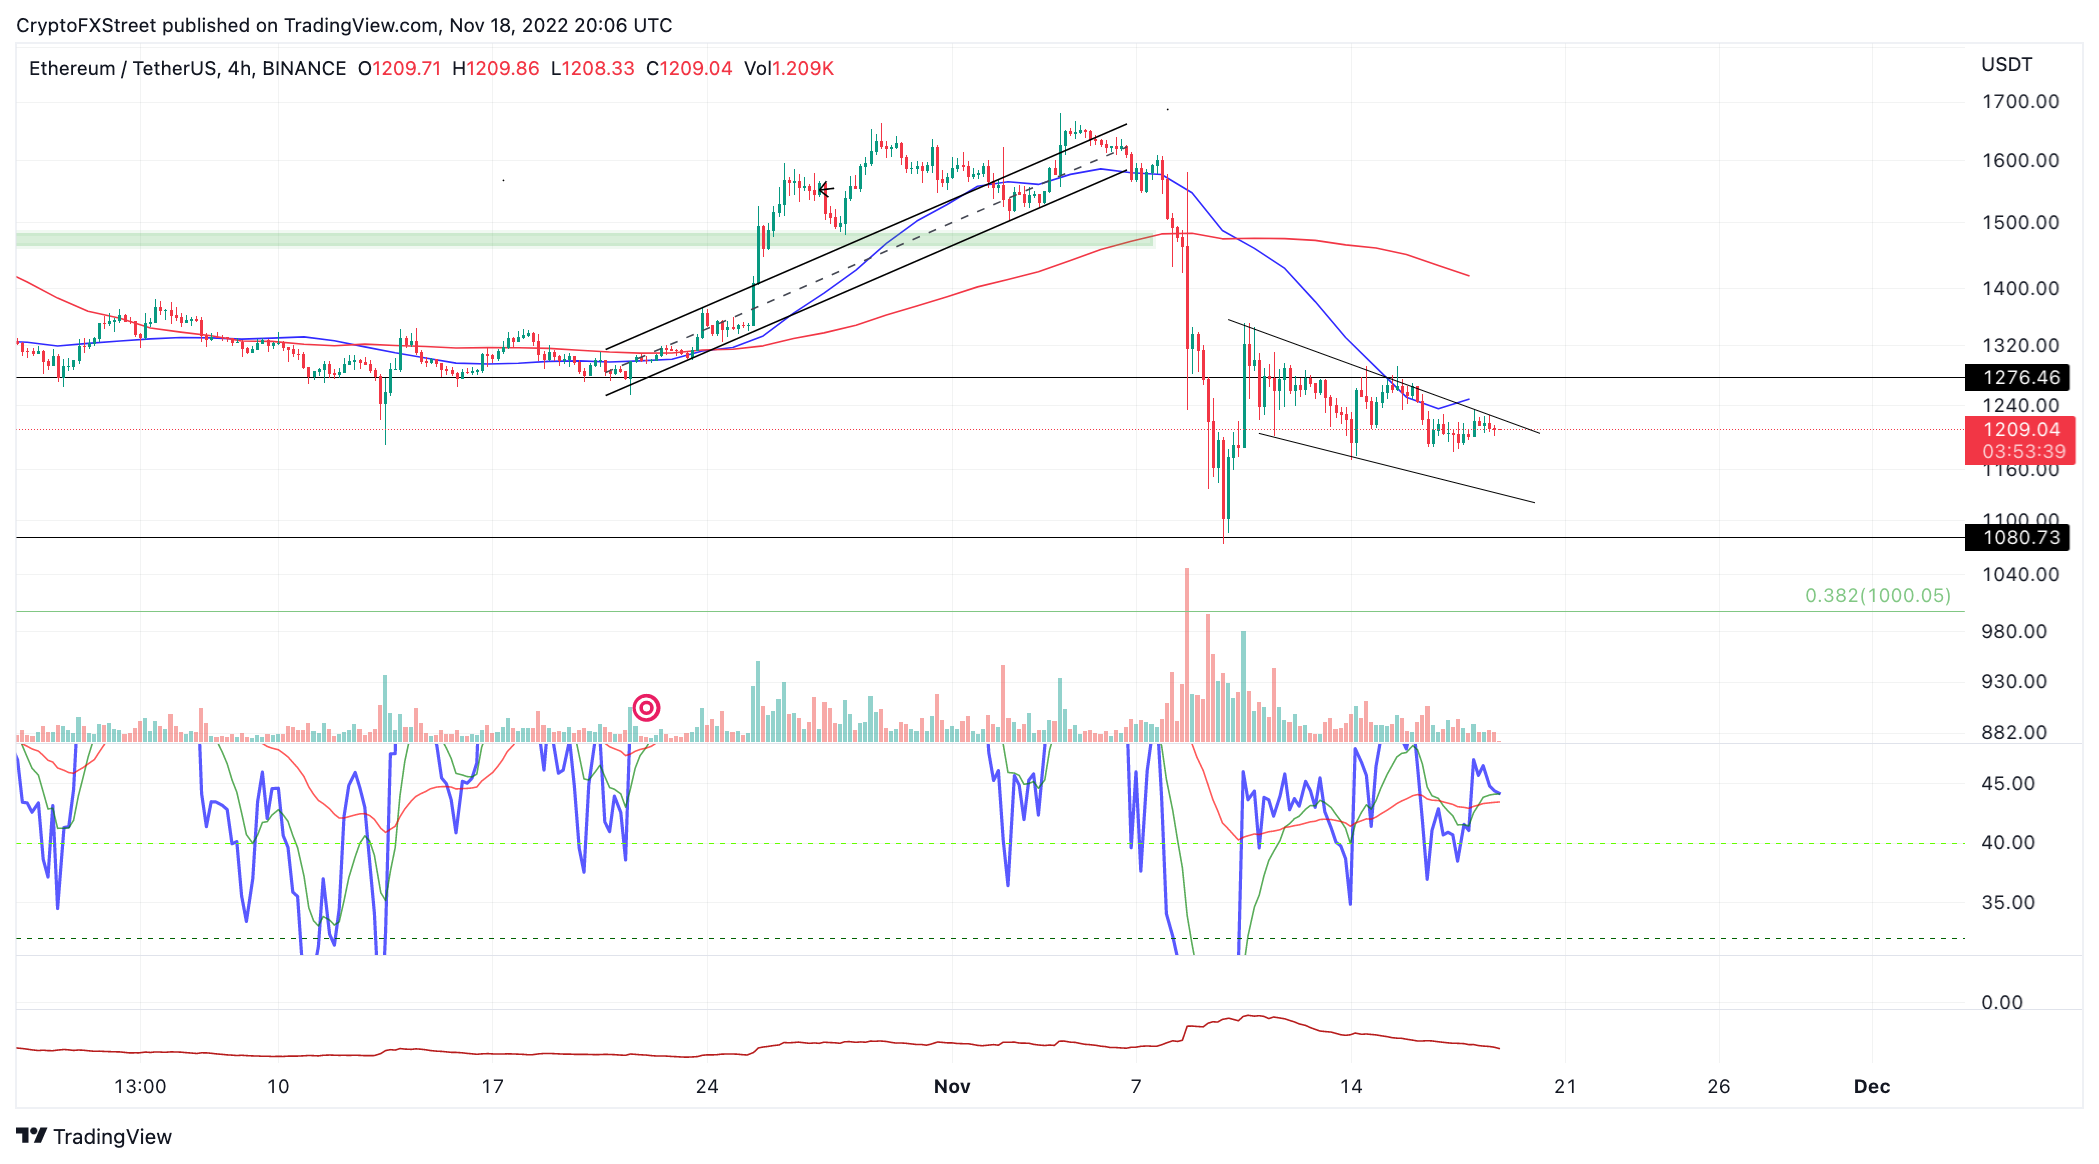
ETHUSDT 4-hour chart
In the following video, our analysts dive deep into the price action of Ethereum, analyzing key market interest levels. -FXStreet Team
XRP price might have one more target to hit
XRP price has diverged from most cryptos as the bulls are resilient to the market’s downtrend suppression. The digital remittance token has yet to form a pennant pattern like the majority of the too cryptos and is at the upper end of the range following its recent decline. XRP price will either expand toward the mid-$0.40 zone or fall sharply in the coming days.
XRP currently auctions at $0.37. The bulls have hurdled above the 8-day exponential moving average (EMA) and are retesting the indicator for added support. The Relative Strength Index (RSI) has climbed back into support and hovers above both of the RSI’s moving averages, which is an optimistic signal. If the market is preparing for a larger countertrend bounce, a hike toward the recently broken support zone at $0.46 would be an ideal target to aim for.
Still, the bullish outlook targeting $0.46 depends on the swing lows at $0.316 holding as support. A breach of the lows could send XRP to the 2020 congestion zone near $0.26. The XRP price would decline by 35% if said price action were to occur.
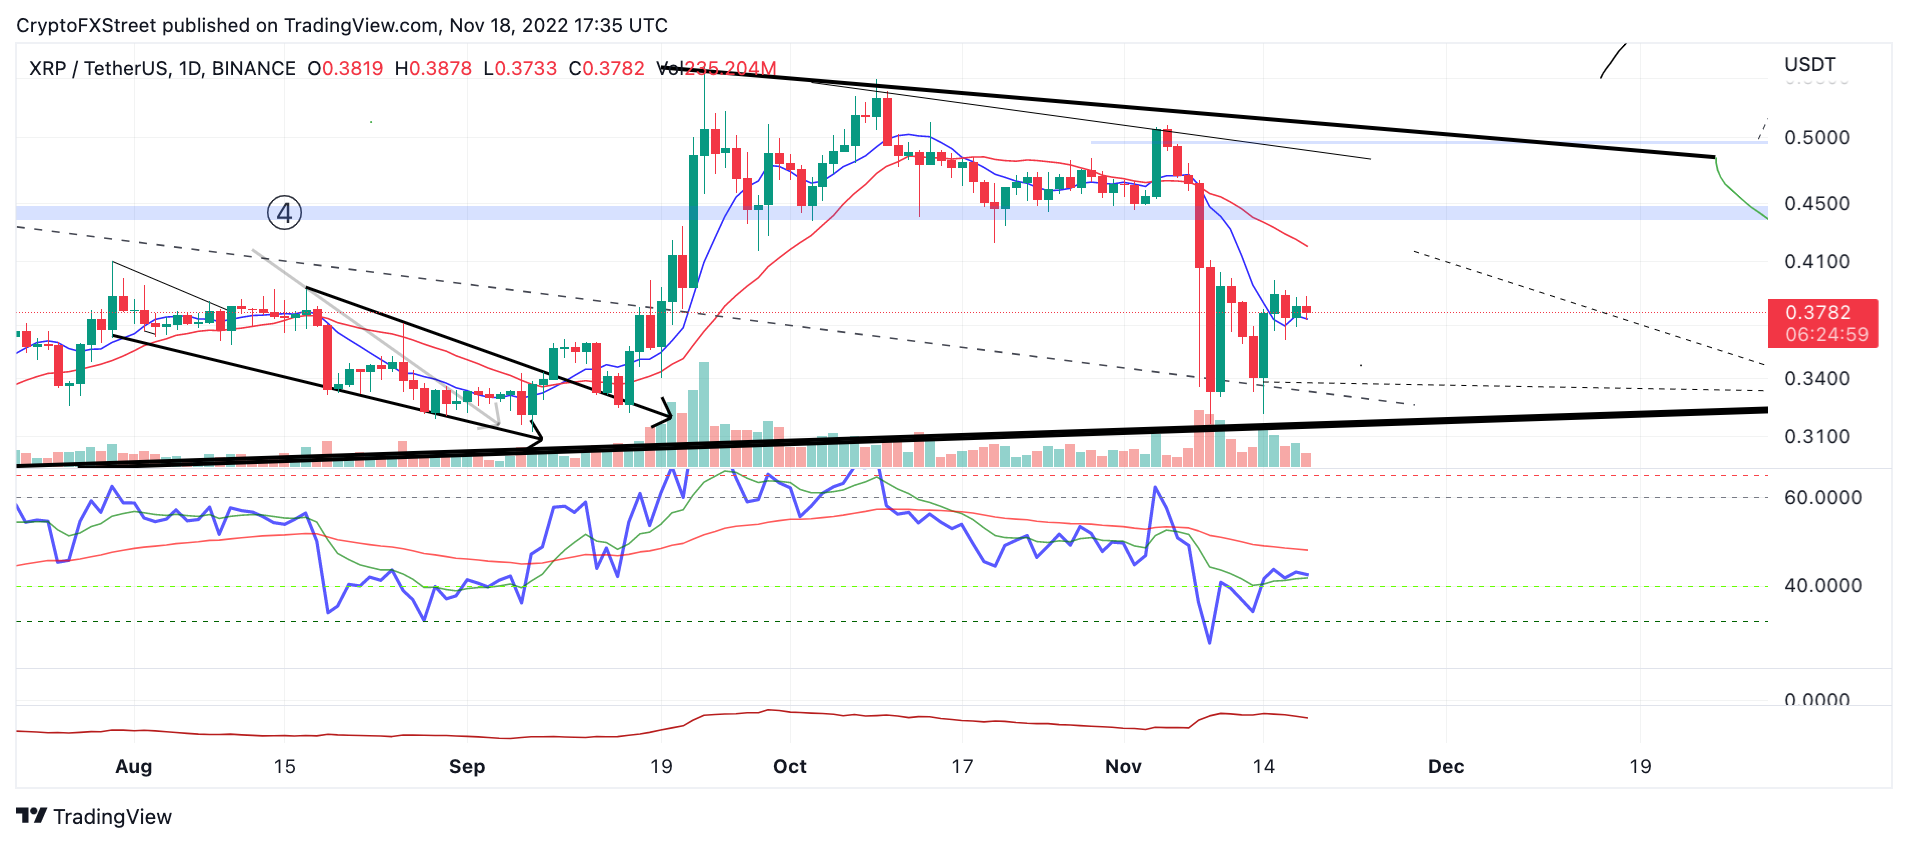
XRPUSDT 1-day chart
In the following video, our analysts dive deep into the price action of Ripple, analyzing key market interest levels. -FXStreet Team
